

Bioinformatics mining and experimental validation of prognostic biomarkers in colorectal cancer
- PMID: 40847013
- PMCID: PMC12373585
- DOI: 10.1007/s12672-025-03301-9
Bioinformatics mining and experimental validation of prognostic biomarkers in colorectal cancer
Abstract
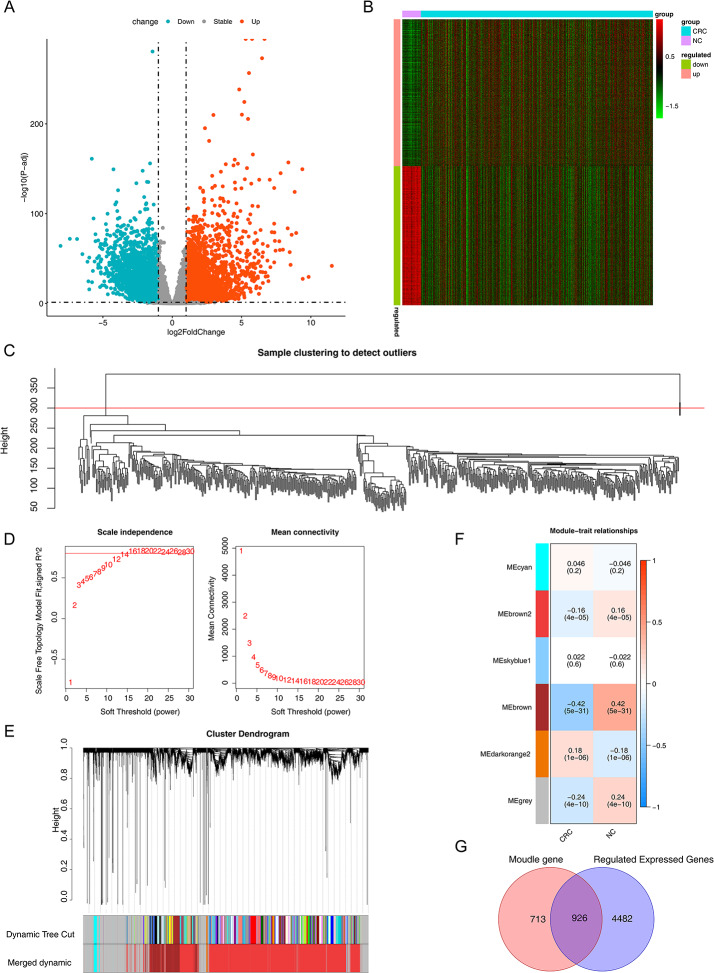
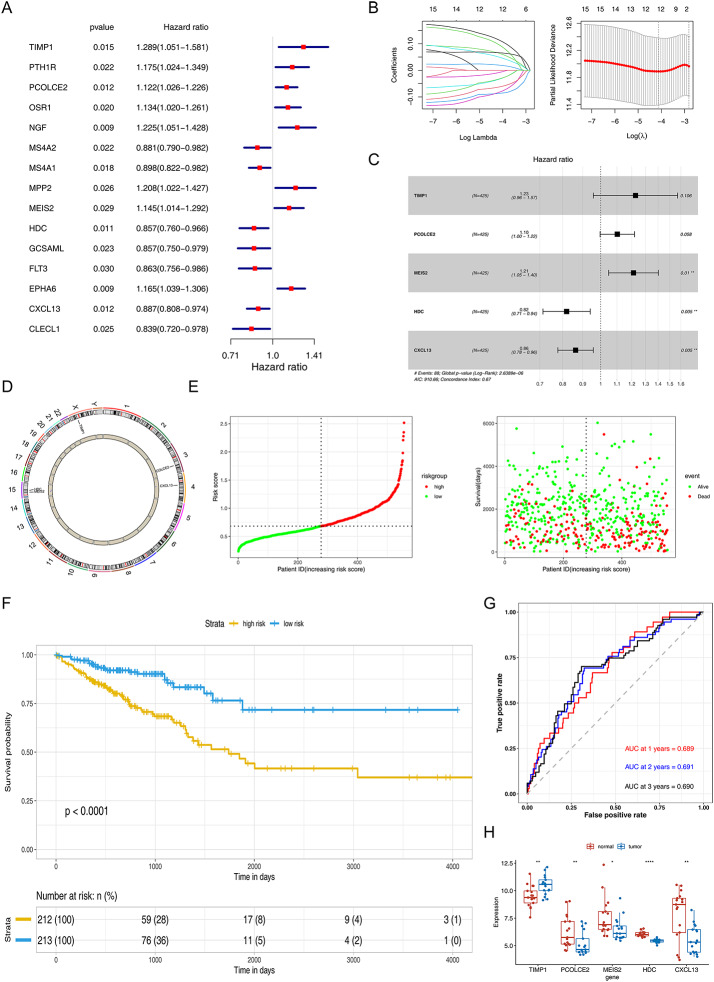
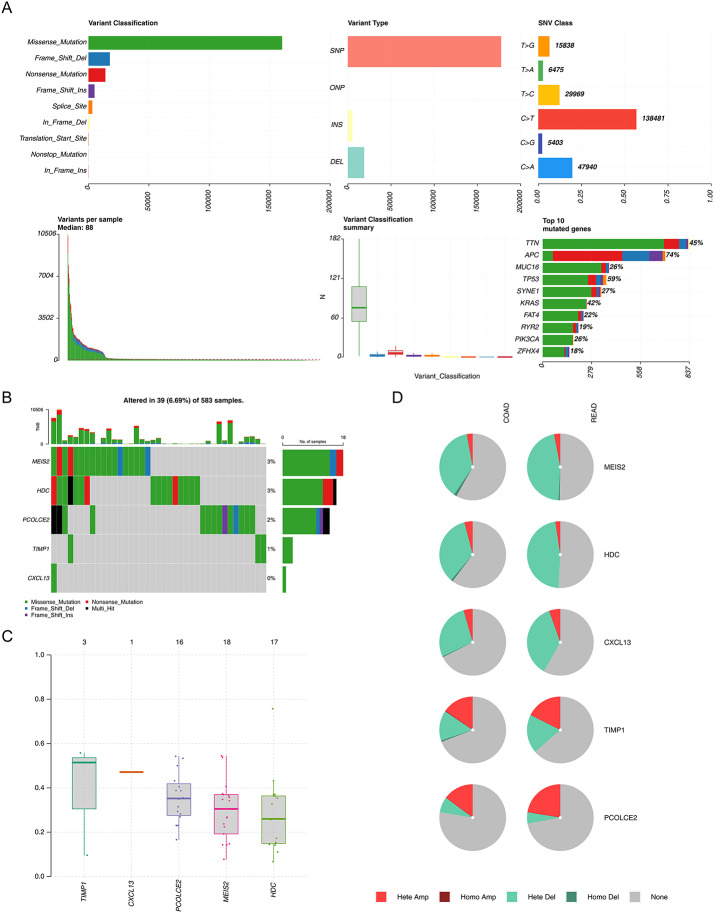
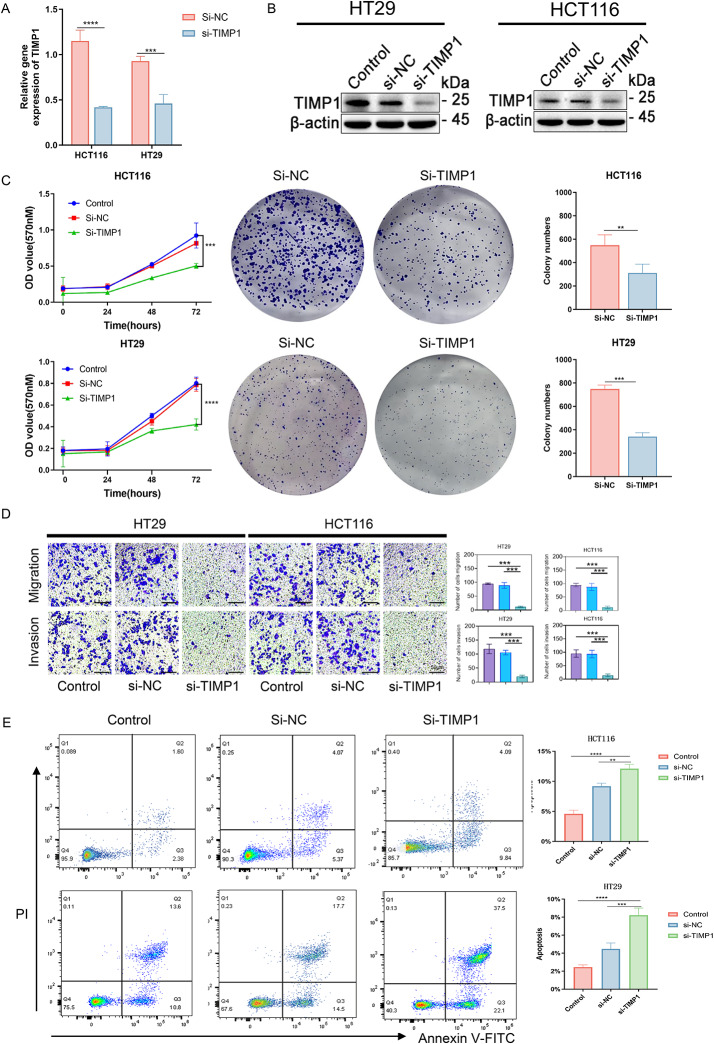
Colorectal cancer (CRC) is a prevalent condition with increasing incidence and mortality rates. The identification of robust prognostic gene signatures remains an unmet clinical need in CRC treatment. In this study, data from the GEO and TCGA databases were utilized to identify 2,779 upregulated and 2,629 downregulated genes in CRC tissues compared to adjacent normal tissues. WGCNA analysis highlighted the MEbrown module, which comprised 1,639 genes that exhibited strong correlations with CRC progression. Subsequently, an intersection analysis was conducted to further refine the candidate gene set, resulting in the selection of 926 differentially expressed CRC-related genes for subsequent analysis. Through univariate Cox regression, LASSO regularization, and multivariate Cox regression, a five-gene prognostic signature (TIMP1, PCOLCE2, MEIS2, HDC, CXCL13) was established, demonstrating consistent predictive accuracy in external (GSE32323) and internal validation cohorts. Mutational profiling showed predominant missense mutations across signature genes, with TIMP1 exhibiting the highest variant allele frequency. Functional enrichment analysis linked TIMP1 to critical CRC pathways including type I interferon receptor binding, oxidative phosphorylation, and Notch signaling pathways. High expression of TIMP1 was associated with poor prognosis in patients with CRC. Additionally, using siRNA technology, the impact of TIMP1 on cellular proliferation, metastasis and apoptosis in CRC cell lines (HCT116 and HT29) was investigated, showing that TIMP1 knockdown significantly inhibited CRC cell proliferation, metastasis, and promoted apoptosis. These experimental results were consistent with the conclusions drawn from the bioinformatics analysis. This research presents a prognostic risk model for CRC, further highlights TIMP1 as a potential biomarker and therapeutic target for the disease.
Keywords: TIMP1; Bioinformatics; Colorectal cancer; Prognostic biomarkers; WGCNA.
© 2025. The Author(s).
Conflict of interest statement
Declarations. Ethics approval and consent to participate: Not Applicable. This study exclusively utilized commercially available colorectal cancer cell lines (HCT116 and HT29) and publicly accessible bioinformatics data from GEO, TCGA, and HPA databases. The use of cell lines and pre-existing anonymized public data does not require ethical approval under institutional or national guidelines. This study did not generate or involve the use of any personally identifiable information (e.g., patient images, genomic sequences linked to individuals). All public database analyses complied with their respective data access policies and publication guidelines. Consent for publication: Not Applicable. Competing interests: The authors declare no competing interests.
Figures


Similar articles
-
Revelation of prognosis and tumor microenvironment of colorectal cancer based on genes related to antibody-dependent cellular phagocytosis and single-cell landscape.Clin Proteomics. 2025 Aug 21;22(1):28. doi: 10.1186/s12014-025-09553-5. Clin Proteomics. 2025. PMID: 40841999 Free PMC article.
-
Construction and validation of a lipid metabolism-related genes prognostic signature for skin cutaneous melanoma.Biochem Biophys Res Commun. 2025 Aug 15;775:152115. doi: 10.1016/j.bbrc.2025.152115. Epub 2025 May 29. Biochem Biophys Res Commun. 2025. PMID: 40460484
-
Construction of a New Ferroptosis-related Prognosis Model for Survival Prediction in Colorectal Cancer.Curr Med Chem. 2025;32(20):4132-4146. doi: 10.2174/0109298673296767240116215814. Curr Med Chem. 2025. PMID: 38362684
-
Cost-effectiveness of using prognostic information to select women with breast cancer for adjuvant systemic therapy.Health Technol Assess. 2006 Sep;10(34):iii-iv, ix-xi, 1-204. doi: 10.3310/hta10340. Health Technol Assess. 2006. PMID: 16959170
-
Impact of residual disease as a prognostic factor for survival in women with advanced epithelial ovarian cancer after primary surgery.Cochrane Database Syst Rev. 2022 Sep 26;9(9):CD015048. doi: 10.1002/14651858.CD015048.pub2. Cochrane Database Syst Rev. 2022. PMID: 36161421 Free PMC article.
References
-
- Dekker E, Tanis PJ, Vleugels JLA, Kasi PM, Wallace MB. Colorectal cancer. Lancet. 2019;394:1467–80. 10.1016/s0140-6736(19)32319-0. - PubMed
-
- Schreuders EH, et al. Colorectal cancer screening: a global overview of existing programmes. Gut. 2015;64:1637–49. 10.1136/gutjnl-2014-309086. - PubMed
-
- Siegel RL, Giaquinto AN, Jemal A. Cancer statistics, 2024. CA Cancer J Clin. 2024;74:12–49. 10.3322/caac.21820. - PubMed
-
- Cancer IA. f. R. o. Colorectal cancer, https://www.iarc.who.int/cancer-type/colorectal-cancer/ (2022).
Grants and funding
LinkOut - more resources
Full Text Sources
Research Materials
Miscellaneous