. 2025 Oct;26(10):1737-1751.
doi: 10.1038/s41590-025-02257-w. Epub 2025 Aug 22.

SATB1 is a key regulator of quiescence in stem-like CD8+ T cells

Affiliations

SATB1 is a key regulator of quiescence in stem-like CD8+ T cells

Siying Lin et al. Nat Immunol. 2025 Oct.

Abstract

Stem-like progenitor CD8+ T (TPRO) cells sustain cytotoxic immunity during chronic infection and cancer through quiescence, multipotency and self-renewal, hallmarks shared with memory T cells. However, how these properties are maintained under persistent antigen stimulation remains unclear. Here we identify the genomic organizer SATB1 as selectively enriched in both TPRO and memory CD8+ T cells. Given its role in promoting quiescence in hematopoietic stem cells, we hypothesized that SATB1 supports CD8+ T cell stemness. Using CD8+ T cell-specific CRISPR deletion of the Satb1 gene, we show that SATB1 is essential for maintaining TPRO cells during chronic lymphocytic choriomeningitis virus infection and for memory CD8+ T cell formation during acute infection. Multi-omic profiling revealed that SATB1 regulates the chromatin accessibility, transcriptional activity and genome architecture of stemness-associated genes including Tcf7, Bach2 and Myb. These findings reveal a critical role for SATB1 in preserving the transcriptional and epigenetic programs that sustain the stem-like state of antigen-specific CD8+ T cells.


Conflict of interest statement

Competing interests: The authors declare no competing interests.

Figures

Extended Data Fig. 1
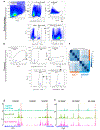
Extended Data Fig. 1. The TPRO subset shows enriched SATB1 expression.
a, Flow plot illustrating CX3CR1 expression stratified by SATB1 levels. b, Representative western blots and summary graph of total SATB1 normalized by GAPDH levels in progenitor, effector, and exhausted CD8+ T cell subsets (n = 2). c, Genomic tracks of mapped ATAC-seq (GSE149752), H3K27ac CUT&TAG, H3K27me3 CUT&TAG (GSE149810) for the 3 subsets of CD8+T cells at the Satb1 locus and nearby Gm20098 locus, displayed on WashU Epigenome Browser. The transcription start site is marked by TSS, with red bars denoting the promoter and enhancer sites.
Extended Data Fig. 2
Extended Data Fig. 2. SATB1 deficiency promotes CD8+ T cell proliferation in various tissues in chronic viral infection.
a-b, Knock-out efficacy of SATB1 in LCMV Cl13 infection; representative flow plots (a) and western Blot (b) of SATB1 comparing sgCtrl (control; orange) and sgSatb1 (SATB1-deficient; blue) P14 cells. c-d, Summary of liver P14 frequency (c) and numbers (d) at various timepoints p.i. (n = 5). e-f, Summary of lung P14 frequency (e) and numbers (f) at various timepoints p.i. (n = 5). g, Experimental design of CRISPR-RNP in single-transfer experiment: CD45.1+ P14 CD8+ cells were transduced with sgCtrl (control; orange cell) or sgSatb1 (SATB1-deficient; blue cell) and then adoptively single-transferred into separate CD45.2+ C57BL/6 recipient mice, which were subsequently infected with LCMV Cl13. h, Flow plot and summary showing the frequency of splenic sgCtrl and sgSatb1P14 cells in single-transfer experiment on day 21 p.i. (n = 5). i, Representative flow plots and summary displaying the frequencies of sgCtrl and sgSatb1 P14 cells in lymph nodes on day 8 p.i. j, Representative flow plots and summary data of SATB1 protein expression in Ly108+ precursor and Tim3+ early effector cells on day 8 p.i. (n = 5). Data in a-j are representative of 2-3 independent experiments, and data points with bars in c-f are means ± s.d. All data points (n) represent individual mice as biological replicates. Exact P-values are shown in each graph; ns = not significant; two-sided multiple pair t- test with Holm-Šídák correction was used in c-f, and i; two-sided unpaired t-test was used in h; two-sided paired t-test was used in j.
Extended Data Fig. 3
Extended Data Fig. 3. SATB1 is essential for maintaining TPRO quiescence during chronic infection.
a-b, Representative flow plots and summary displaying gMFI of T-bet (a) and EOMES (b) in splenic sgCtrl (orange) and sgSatb1 (blue) P14 cells on day 21 p.i. with LCMV Cl13 (n = 5). c, Representative flow plots and summary of CD8+ T cells subset distribution in lymph nodes, showing TPRO (Ly108+ CX3CR1), TEFF (Ly108 CX3CR1+), and TEXH (Ly108 CX3CR1) sgCtrl (orange) and sgSatb1(blue) P14 cells on day 21 p.i. (n = 9). d, Representative flow plot and summary of TPRO1 (Ly108+ CD62L+) and TPRO2 (Ly108+ CD62L) frequencies of sgCtrl and sgSatb1 P14 cells in lymph nodes on day 21 p.i. (n = 9). e, PCA plot of RNA-seq data for sgCtrl and sgSatb1 P14 cells on day 21 p.i. with LCMV Cl13 (n = 5). f, Heatmaps of 1767 DEGs between sgCtrl (838 genes) and sgSatb1 (929 genes) P14 cells (adjusted p value < 0.05); selected DEGs are indicated. g, GSEA of hematopoietic cell lineage commitment from KEGG (Pathway ID: mmu04640) between sgCtrl and sgSatb1 P14 cells. h-m, Flow and summary plots corresponding to Fig. 3j. Representative flow plot and summary of Ki67 expression (h), Annexin-V (i), granzyme B (j), TCF1 (k), LEF1 (l), and CD62L (m), and in sgCtrl and sgSat1 splenic P14 cells on day 14 post-transfer (n = 5). All data points (n) represent individual mice as biological replicates. Exact P-values are shown in each graph. Data in a-d and h-m are representative of 2-3 independent experiments. Two-sided paired t-test is used in a-b, h-j; two-sided multiple pair t-test with Holm-Šídák correction was used in c-d; ns = not significant.
Extended Data Fig. 4
Extended Data Fig. 4. SATB1 limits terminal differentiation in the chronic phase of infection.
a-d, Representative flow plots and summary showing gMFI of CD101 (a), LAG3 (b), TIM-3 (c), and TOX (d) in sgCtrl (control; orange) and sgSatb1 (SATB1-deficient; blue) splenic P14 cells on day 21 p.i. with LCMV Cl13 (n = 5). e, Heatmaps of DEGs representing inhibitory molecules between sgCtrl and sgSatb1 (adjusted p value < 0.05; n = 5). f-j, Flow and summary plots corresponding to Fig. 4h (n = 5). f, Summary of splenic P14 frequencies in sgCtrl (orange) and sgSatb1 (blue) as shown Fig. 4h. g, Representative flow plots and summary of Ki67+ percentages in P14 cells. h, Summary of absolute cell number in TPRO, TEFF, and TEXH subsets. i-j, Representative flow plots and summary LEF1+ percentages (i), and CD62L+ percentages (j) in P14 cells (n = 5). k, Summary data of viral titer in the sera from experimental mice receiving sgCtrl or sgSatb1 P14 cells (n = 5; bar and interval represent means ± s.d.). All data points (n) represent individual mice as biological replicates. Exact P-values are shown in each graph. Data in a-d and f-j are representative of 2-3 independent experiments; two-sided paired t-test was used in a-g and i-j; two-sided multiple paired t-test with Holm-Šídák correction was used in h; unpaired t-test with Welch’s correction was used in k; ns = not significant.
Extended Data Fig. 5
Extended Data Fig. 5. Satb1fl/fl-CD8cre mice phenocopy CRISPR-mediated SATB1-deletion mice.
a, Schematic of the experimental design: Satb1 + /+ CD8Cre (WT) or Satb1fl/fl CD8Cre (KO) mice were infected with LCMV Cl13 and analyzed at day 21 p.i. b, Frequency of GP33-41-specific CD8+ T cells in spleen. c-d, Representative flow cytometry plots of GP33-41 tetramer staining (c) and CD8+ T-cell subset distribution. e, Quantification of TPRO and combined TEFF + TEXHsubsets among GP33-41-specific CD8+ T cells. f-i, Representative flow plots and summary of SATB1 (f), TCF-1 (g), PD-1 (h), and CXCR6 (i) expression in WT and KO GP33-41-specific CD8+ T cells. Data represent two independent experiments with n = 5 mice per group. All data points (n) represent individual mice as biological replicates. Bar and interval in graphs represent means ±s.d. Exact P-values are shown in each graph. Statistical significance was determined by two-sided unpaired t-test with Welch’s correction in b, f-i; multiple unpaired t-test with Holm-Šídák correction was used in e.
Extended Data Fig. 6
Extended Data Fig. 6. SATB1 restrains effector differentiation during acute infection.
a, Knockout efficacy of SATB1 on day 35 p.i. with LCMV Armstrong: representative flow plots and a summary of SATB1 gMFI comparing sgCtrl (control; orange) and sgSatb1 (SATB1-deficient; blue) P14 cells (n = 5). b, Representative flow plots depicting sgCtrl (top panel; orange) and sgSatb1 (bottom panel; blue) KLRG1+ IL-7Rα+ P14 short-lived effector cells (SLECs) and KLRG1 IL-7Rα+ memory precursor effector cells (MPECs) isolated from blood at various post-infection timepoints. c-d, Summary of sgCtrl and sgSatb1 P14 SLECs (c) and MPECs (d) at various post-infection timepoints shown in b (n = 12; data points with interval represents means ± s.d.). e, Representative flow plots displaying the frequencies of sgCtrl (orange) and sgSatb1 (blue) splenic P14 cells on day 7 p.i. with LCMV Armstrong. f, Representative flow plots and summary depicting the frequencies of sgCtrl and sgSatb1 SLECs and MPECs isolated from splenocytes (n = 5). g-i, Representative flow plots and summary showing the percentages of TCF-1+ (g), CXCR3+ (h), and CX3CR1+ P14 cells in sgCtrl and sgSatb1 on day 7 p.i. (n = 5). All data points (n) represent individual mice as biological replicates. Exact P-values are shown in each graph. Data in a-i are representative of 2-3 independent experiments. Statistical significance was determined by two-side paired t-test in a and g-I; multiple paired t-test with Holm-Šídák correction was used in c-e.
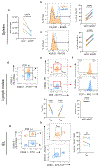
Extended Data Fig. 7
Extended Data Fig. 7. SATB1 is necessary for differentiating TCM but not TRM cells.
a, Summary of absolute number of sgCtrl (control; orange) and sgSatb1 (SATB1-deficient; blue) P14 cells in spleen on day 35 p.i. with LCMV Armstrong (n = 4). b-c, Representative flow plot and summary showing the percentages of CX3CR1+ (b) and KLRG1+ (c) splenic P14 cells in sgCtrl and sgSat1 on day 35 p.i. (n = 5). d, Representative flow plots displaying the frequencies of sgCtrl and sgSatb1 P14 cells in lymph nodes on day 35 p.i. (n = 5). e, Representative flow plots and summary depicting sgCtrl and sgSatb1 CD62L+ central memory (TCM) and CD62Leffector memory (TEM) cells in lymph nodes on day 35 p.i. (n = 5). f, Representative flow plots and summary showing percentage of TCF-1+ TCM cells in lymph nodes of sgCtrl and sgSatb1. (n = 5). g, Representative flow plots displaying the frequencies of sgCtrl and sgSatb1 P14 cells in intestinal intraepithelial lymphocytes (IEL) on day 35 p.i. h, Representative flow plots and summary showing percentages of sgCtrl and sgSatb1 CD69+ CD103+ resident memory (TRM) cells from IEL on day 35 p.i. (n = 5). All data points (n) represent individual mice as biological replicates. Exact P-values are shown in each graph. Data in a-h are representative of 2-3 independent experiments. Statistical significance was determined by two-side paired t-test in a and a-b and h; multiple paired t-test with Holm-Šídák correction was used in e. ns = not significant.
Extended Data Fig. 8
Extended Data Fig. 8. SATB1 regulates the epigenetic program of stemness in TPROcells.
P14 cells transduced with sgCtrl and sgSatb1 were adoptively transferred into recipient mice, followed by LCMV Cl13 infection. On day 21, p.i., these P14 cells were sorted and analyzed by ATAC-seq. Four replicates were included in each group. a, Representative flow plots showing sgCtrl or sgSatb1 P14 cells sorting panel (a) and post-sort purity (b). c, Spearman distance analysis using all differentially accessible peaks (DAPs) between indicated populations (FDR ≤ 0.01, lfc≥2). Color indicates distances. d-e, Sequencing tracks of SATB1 ChIP seq (GSE191146), ATAC of TPRO subset (GSE149752), and CUT&TAG of TPRO H3K27ac (GSE149810) at indicated (d) Il7r locus and (e) Tcf7 locus. The differentially accessible peaks between sgCtrl and sgSatb1, illustrated in Fig. 6j–k, are highlighted with a red bar.
Extended Data Fig. 9
Extended Data Fig. 9. SATB1 regulates the quiescence of TPRO in a subset-specific manner.
a-b, Dot plots showing expression of cluster markers. Dot size denotes the number of cells with a particular gene expressed, and intensity of dot color indicates the expression level of RNA (a) and gene accessibility (b). c, Module scores of the top 100 differentially expressed genes from previously identified progenitor, effector, and exhausted CD8+ T cells for all subsets in sgCtrl and sgSatb1. d-e, Coverage plots showing ATAC tracks at Myb (d) and Tnfsf8(e) loci in sgCtrl and sgSatb1 TPRO cluster, with gene expression levels displayed as violin plots on the right side. TSS represents the transcription start site, grey boxes under the track represent putative enhancers, and links between the enhancers and the promoter are associated with promoter-enhancer interaction. Red bars mark examples of differentially accessible enhancers between sgCtrl and sgSatb1 in the TPRO cluster.
Extended Data Fig. 10
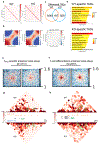
Extended Data Fig. 10. SATB1 plays a role in maintaining the chromatin architecture in TPRO-associated genes.
a, Whole-genome Hi-C contact matrices at 100 kb resolution for wild-type (WT left) and Satb1 knockout (Satb1-KO; right) CD8+ T cells. b, Saddle plots ranked by eigenvector percentiles display chromatin compartmentalization in WT (left), KO (middle) conditions, and the log2ratio of KO/WT compartmentalization (right). c, a Venn diagram displaying differential and shared topologically associating domains (TADs) between WT and KO at 50 kb resolution. d, Pathway enrichment analysis of genes within WT-specific (top panel) and KO-specific TADs (bottom panel), identified using HOMER-based annotation and ShinyGO. e, Loop pileup of TPRO-specific enhancer sites (N = 2,151) anchored at genome regions in WT (right) and KO (left), visualized at 10 kb resolution. f, Loop pileup of enhancer regions associated with T-cell differentiation (N = 2,670) anchored at genome regions in WT (right) and KO (left), visualized at 10 kb resolution. g-h, Hi-C heatmap maps at 10 kb resolution displaying distance-normalized chromatin interactions in WT (top) and KO (bottom) at the Tcf7 (g) and Myb (h) loci, visualized on Pygenome. The green boxes mark chromatin interactions with changes. ATAC-seq tracks of sgCtrl (orange) and sgSatb1 (blue) CD8+ T cells are shown between Hi-C heatmaps.
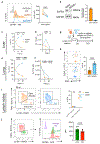
Fig. 1:
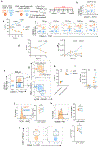
Fig. 1:. SATB1 is specifically enriched in progenitor CD8+ T cells during chronic viral infection.
a-e, C57BL/6 mice received naïve P14 CD8+ T cell and were infected with LCMV Cl13. scRNA-seq and flow cytometric analysis were performed with P14 cells isolated from mice on day 21 post-infection (p.i.). a, Uniform manifold approximation and projection (UMAP) plot of 9,491 single antigen-specific CD8+ T cells colored according to cluster identification: progenitors (TPRO), effector (TEFF), exhausted (TEXH). b, Heatmap showing the expression of all identified cluster signature transcripts. c, Violin plot showing the RNA expression of Satb1 in the three subsets of CD8+ T cells. d, Representative flow plots depicting 3 distinct subsets of splenic P14 CD8+ T cells on day 21 p.i. e, Representative flow plots and summary data of SATB1 protein expression in the 3 subsets of CD8+ T cell (n = 5 for each subset; one-way ANOVA with Geisser Greenhouse correction; bar with interval represents means represent means ± s.d.). All data points (n) represent individual mice as biological replicate. Exact P-values are shown in each graph. Data in d-e represent 2-3 independent experiments
Fig. 2:
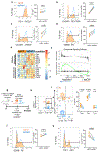
Fig. 2:. SATB1 deficiency promotes late-stage proliferation of CD8+ T cells during chronic viral infection.
a, Experimental design of CRISPR-RNP: CD45.1+ P14 CD8+ T cells were transduced with sgCtrl (control; orange cell) and sgSatb1 (SATB1-deficient; blue cell) and then adoptively co-transferred in a 1:1 mix into CD45.2+ C57BL/6 recipient mice, which were subsequently infected with LCMV Cl13. b, Representative flow plot of the 1:1 mix of sgCtrl and sgSatb1P14 cells on day 0. c, Summary and representative flow plots showing the frequency of sgCtrl and sgSatb1 P14 cells in blood at various timepoints post-infection (n = 5 for both sgCtrl and sgSatb1). d-e, Summary of splenic P14 frequency (d) and numbers (e) at various timepoints p.i. (n = 10 for both sgCtrl and sgSatb1). f, Representative flow plots displaying the frequencies of splenic sgCtrl (orange) and sgSatb1 (blue) P14 cells on day 8 p.i. (n = 5). g-i, representative flow plots (g) and summary displaying the frequencies (h) and absolute numbers (i) of Ly108+ precursor and TIM3+ early effector cells (n = 5). j-l, Representative flow plots and summaries showing TCF-1 (j), granzyme B (k), and Ki67 (l) expression in splenic P14 cells on day 8 p.i. (n = 5). All data points (n) represent individual mice as biological replicates. Data in a-l are representative of 2-3 independent experiments. Exact P-values are shown in each graph; data points in c-e represent means ± s.d; two-sided multiple paired t-test with Holm-Šídák correction was used in c-e; two side paired t test was used in h-i. ns = not significant.
Fig. 3:
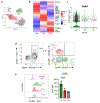
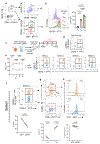
Fig. 3:. SATB1 deficiency disrupts the maintenance of the TPRO subset during the chronic phase of viral infection.
a, Representative flow plot displaying the frequencies of sgCtrl (control; orange) and sgSatb1 ( SATB1-deficient; blue) splenic P14 cells on day 21 p.i. b-d, Representative flow plots (b), summary of the subset distribution (c), and cell number (d) of TPRO (Ly108+ CX3CR1), TEFF (Ly108 CX3CR1+), and TEXH (Ly108 CX3CR1) in splenic P14 cells (n = 9). e, Representative flow plot and summary of TPRO1 (Ly108+ CD62L+) and TPRO2 (Ly108+ CD62L) frequencies in splenic P14 cells. f, Ratio of TPRO P14 cell frequency (Day x / Day 8) in sgCtrl and sgSatb1 splenic P14 cells at indicated time point (n = 9 biological replicate for each timepoint; ratio of Dx/D8 TPRO % was calculated from each biological replicate at different timepoint; data point represent mean ± s.d.). g, Flow plot and summary of TCF-1 expression in sgCtrl and sgSatb1 splenic P14 cells (n = 5). h, Heatmaps of differentially expressed genes (DEGs) between sgCtrl and sgSatb1 P14 cells (adjusted p value < 0.05); selected DEGs in each category are indicated. i, GSEA of pluripotency of stem cell from KEGG (Kyoto Encyclopedia of Genes and Genomes, Pathway ID: mmu04550) between sgCtrl and sgSatb1 P14 cells. j, Experimental design utilizing CRISPR-mediated Satb1 deletion (sgSatb1; blue cell) or CD19 deletion as a control (sgCtrl; orange cell) in TPRO P14 CD8+ T cells to assess their differentiation trajectory following adoptive transfer into infection-matched recipient mice. k, Representative flow plot and summary of splenic P14 percentage in sgCtrl vs. sgSatb1 (n = 7). l, Representative flow plots and summary of subset distribution of TPRO (Ly108+ CX3CR1), TEFF (Ly108 CX3CR1+), and TEXH (Ly108 CX3CR1) in splenic P14 cells on day 28 p.i. m-n, Summary of percentage of subset distribution (m) and cell number of each subset (n) (n = 7). Data in a-g and j-n are representative of 2-3 independent experiments. All data points (n) represent individual mice as biological replicates; exact P-values are shown in each graph; two-sided multiple paired t-test with Holm-Šídák correction was used in c-g, and m. two-sided paired Student’s t-test was used in k.
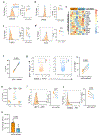
Fig. 4:
Fig. 4:. SATB1 deficiency promotes terminal differentiation during the chronic phase of viral infection.
a-d, Representative flow plots and summary showing gMFI or percentage of PD-1 (a), CXCR6 (b), CX3CR1 (c), and Granzyme B (d) in P14+ cells from sgCtrl (control; orange) and sgSat1 (SATB1-deficient; blue) splenic P14 cells on day 21 p.i. (n = 5). e, Heatmaps of DEGs between sgCtrl and sgSatb1 P14 cells (adjusted p value < 0.05); selected DEGs in each category are indicated. f, GSEA of antigen processing from KEGG (Pathway ID: mmu04062) between sgCtrl and sgSatb1 P14 cells. g, Experimental design of CRISPR-RNP: CD45.1+ P14 CD8+ cells were transduced with sgCtrl (control; orange cell) and sgSatb1 (SATB1-deficient; blue cell) and then adoptively co-transferred in a 1:1 mix into CD45.2+ C57BL/6 recipient mice that had been infected with LCMV Cl13 for 14 days. h, Representative flow plots displaying the frequencies of sgCtrl and sgSatb1 splenic P14 cells on day 28 p.i., or day 14 post-transfer. i, Representative flow plots and summary of subset distribution of TPRO (Ly108+ CX3CR1), TEFF (Ly108 CX3CR1+), and TEXH (Ly108 CX3CR1) in splenic P14 cells in panel h. j-k, Representative flow plots and summary showing the Granzyme B (j) and TCF-1 (k) percentage in sgCtrl and sgSatb1 splenic P14 cells on day 28 p.i. (day 14 post-transfer). All data points (n) represent individual mice as biological replicates. Exact P-values are shown in each graph. Data in a-d and g-k are representative of 2-3 independent experiments, Paired t- test was used in a-d, and j-k; two-sided multiple paired t-test with Holm-Šídák correction was used in i.
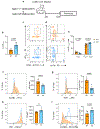
Fig. 5:
Fig. 5:. SATB1 is required for memory CD8+ T cell formation during acute viral infection.
a-b, C57BL/6 mice received naïve P14 CD8+ T cells and were infected with LCMV Armstrong for acute infection. Flow cytometric analysis was performed with P14 cells isolated from small intestinal intraepithelial lymphocytes (IEL) and splenocytes on day 35 p.i. a, Representative flow plots showing resident memory CD8+ T cells (TRM; CD69+ CD103+) isolated from IEL, central memory CD8+ T cell (TCM; CD62L+), and effector memory CD8+ T cell (TEM; CD62L) from splenocytes. b, Representative flow plot and summary depicting SATB1 expression as gMFI in different subsets of memory CD8+ T cells (n = 5). c, Experimental design of CRISPR-RNP: CD45.1+ P14 CD8+ cells were transduced with sgCtrl (control; orange cell) and sgSatb1 (SATB1-deficient; blue cell), and then adoptively co-transferred in a 1:1 mix into CD45.2+ C57BL/6 recipient mice, which were subsequently infected with LCMV Armstrong. d, Representative flow plot of 1:1 mix of sgCtrl and sgSatb1 P14 cells on day 0. e, Summary and representative flow plots illustrating the ratio and frequency of sgCtrl and sgSatb1 P14 cells in the blood at different post-infection time points (n = 4; one-way ANOVA with Geisser Greenhouse correction; bar with interval represents means ± s.d.). f, Representative flow plot and summary showing the frequencies of sgCtrl and sgSatb1 splenic P14 cells on day 35 p.i. of LCMV Armstrong (n = 4). g, Representative flow plots and summary depicting the percentage of CD62L+ TCM and CD62L TEM subsets from sgCtrl and sgSatb1 P14 cells in panel f. h, Representative flow plots and a summary showing the percentage of TCF-1+ TCM cells from sgCtrl and sgSatb1. All data points (n) represent individual mice as biological replicates; exact P-values are shown in each graph. Data in a-h are representative of 2-3 independent experiments. two-sided multiple paired t-test with Holm-Šídák correction was used in e; two-sided paired t-test was used in f-h.
Fig. 6:
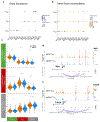
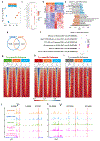
Fig. 6:. SATB1 regulates the epigenetic landscape of the TPRO subset.
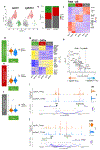
a, PCA of ATAC-seq data generated from sgCtrl (control; orange) and sgSatb1 (SATB1-deficient; blue) P14 cells sorted on day 21 p.i. of LCMV Cl13 (n = 4 in each group). b, Venn diagram showing the overlapping and condition-specific chromatin accessible regions identified by occupancy analysis. c, Dot plot depicting the most significantly enriched motifs in sgCtrl and sgSatb1 peak sets identified in the occupancy analysis in panel b. Dot size shows the percentage of condition-specific sequences that contain the motifs. The dot color indicates the normalized enrichment score. d, Heatmap showing unsupervised clustering of differentially accessible chromatin regions (log2FoldChange >1.5) between sgSatb1 and sgCtrl1. e, KEGG pathway analysis showing the top 9 upregulated and top 9 downregulated pathways in the differentially accessible chromatin regions presented in Panel d. f, GSEA analysis depicting the indicated signatures’ enrichment in the differentially accessible chromatin regions presented in panel d. g-i, Heatmaps showing accessibility for the specified population at the CD8+ T cell subset-specific enhancer regions identified through H3K27ac CUT&TAG (GSE149769; GSE149810). g, TPRO enhancer ATAC peaks identified in TPRO subset, sgCtrl, and sgSatb1 P14 cells. h, TEFF enhancer ATAC peaks identified in TEFF subset, sgCtrl, and sgSatb1 P14 cells. i, TEXH enhancer ATAC peaks identified in TEXH subset, sgCtrl, and sgSatb1 P14 cells. j-k, Sequencing tracks of ATAC (sgCtrl, sgSatb1, TPRO) and CUT&TAG (H3K27ac and H3K4me3 of TPRO subset) at the indicated gene locus are displayed using the WashU Epigenome Browser. The numbers at the top represent chromatin position in base-pairs. TSS indicates the transcription start site. Red bars highlight the differentially accessible peaks between sgCtrl and sgSatb1.
Fig. 7:
Fig. 7:. Single-cell multiomics reveals that SATB1 maintains the quiescent state of TPRO by regulating stemness-associated genes in a subset-specific manner.
a, Weighted-nearest-neighbor Uniform Manifold Approximation and Projection (wnnUMAP) plot of sgCtrl (control) and sgSatb1 (SATB1-deficient) P14 CD8+ T cells, FACs-sorted on day 21 post-LCMV Cl13 infection and analyzed through scMultiome sequencing (scRNA + scATAC). Cells are colored by cluster identity. b, Frequency bar plot showing cluster distribution frequencies in sgCtrl and sgSatb1 groups. c, Heatmap of differentially expressed genes (DE) in sgCtrl and sgSatb1 groups for each cell subset identity with K-means clustering. d-f, Module scores were calculated using the top 100 differentially expressed genes from previously defined progenitor (d), effector (e), and exhausted (f) CD8+ T cells signatures (GSE129139), and evaluated within the TPRO cluster of sgCtrl and sgSatb1 groups. g, Heatmap of differentially accessible chromatin regions (DARs) in sgCtrl and sgSatb1 groups for each cell cluster, identified with K-means clustering. h, Volcano plot showing differentially accessible motifs between sgCtrl and sgSatb1 in the TPRO cluster. i-j, Coverage plots showing ATAC tracks at Il7r (i) and Tcf7 (j) loci in sgCtrl and sgSatb1 TPRO cluster, with gene expression levels displayed as violin plots on the right side. TSS represents the transcription start site, grey boxes under the track represent putative enhancers, and links between the enhancers and the promoter are associated with promoter-enhancer interaction. The orange downward triangle and red bars mark the corresponding chromosome positions highlighted in Fig. 6h–i.

References

    1. Kaech SM & Cui W Transcriptional control of effector and memory CD8+ T cell differentiation. Nat Rev Immunol 12, 749–761 (2012). - PMC - PubMed
    1. Obar JJ & Lefrancois L Memory CD8+ T cell differentiation. Ann N Y Acad Sci 1183, 251–266 (2010). - PMC - PubMed
    1. Badovinac VP, Porter BB & Harty JT CD8+ T cell contraction is controlled by early inflammation. Nat Immunol 5, 809–817 (2004). - PubMed
    1. Joshi NS et al. Inflammation directs memory precursor and short-lived effector CD8(+) T cell fates via the graded expression of T-bet transcription factor. Immunity 27, 281–295 (2007). - PMC - PubMed
    1. Sarkar S et al. Functional and genomic profiling of effector CD8 T cell subsets with distinct memory fates. J Exp Med 205, 625–640 (2008). - PMC - PubMed

MeSH terms

Substances

LinkOut - more resources