. 2025 Oct;26(19):4794-4819.
doi: 10.1038/s44319-025-00556-9. Epub 2025 Aug 22.

SRAS1.1 E3 ligase mediates DSK2A degradation to regulate autophagy and drought tolerance in Arabidopsis

Affiliations

SRAS1.1 E3 ligase mediates DSK2A degradation to regulate autophagy and drought tolerance in Arabidopsis

Xiao-Hu Li et al. EMBO Rep. 2025 Oct.

Abstract

Drought stress significantly impacts plant growth and productivity, requiring complex adaptive responses to ensure survival. In eukaryotes, autophagy and the ubiquitin-proteasome system (UPS) are critical pathways for maintaining cellular homeostasis under stress. While their interaction is well-studied in animals, it remains poorly understood in plants, particularly under drought conditions. Here, we identify the E3 ubiquitin ligase SRAS1.1 as a key regulator of selective autophagy and drought tolerance in Arabidopsis, mediating its function through the ubiquitination and degradation of the autophagy receptor DSK2A. Loss of SRAS1.1 enhances drought tolerance by reducing water loss, increasing survival rates, and accelerating flowering. SRAS1.1 directly interacts with and ubiquitinates the autophagy receptor DSK2A, promoting its degradation via the 26S proteasome. Notably, under drought stress, SRAS1.1 relocates from the nucleus to the cytoplasm, associates with autophagosomes, and modulates autophagy-related gene expression and BES1 accumulation. These findings provide novel insights into UPS-autophagy crosstalk in plants and highlight SRAS1.1 as a promising target for genetic engineering to develop drought-resilient crops and to advance sustainable agriculture.

Keywords: Autophagy; DSK2A; Drought Stress; E3 Ubiquitin Ligase; Stress Tolerance.


Conflict of interest statement

Disclosure and competing interests statement. The authors declare no competing interests.

Figures
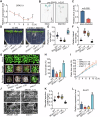
Figure 1
Figure 1. SRAS1.1 negatively regulates drought tolerance in Arabidopsis.
(A) Quantitative measurement of the SRAS1.1 transcript level in 2-week-old wild-type (Col-0) plants after drought stress for 0, 1, 3, 6, 9, or 12 h. UBQ10 was used as an internal control. Values shown are means ± SD (n = 3 biological replicates). P values = 0.0725 (0 h vs 1 h), 0.0131 (0 h vs 3 h), 0.0022 (0 h vs 6 h), 0.0017 (0 h vs 9 h), 0.0042 (0 h vs 12 h). (B, C) GUS staining (B) and quantitative activity analysis of proSRAS1.1:GUS seedlings (C) under mock and mannitol treatment. Scale bars = 1 mm. Values shown are means ± SD (n = 5 biological replicates). Significance was determined using Student’s t test. P values < 0.0001. (DF) Representative seedlings of wild-type, SRAS1.1-overexpressing lines (SRAS1.1-OE), and sras1.1 mutants after 2 weeks of growth in 1/2 MS medium with or without 250 mM mannitol. Scale bars = 1 cm. Primary root length (E) and lateral root density (F) of seedlings shown in (D). Both graphs are presented as the percentage relative to growth on control 1/2 MS medium, and it was designated as 1 in wild-type. Values shown are means ± SD (n = 3 biological replicates), with 20 plants analyzed per replicate. (E) P values < 0.0001 (wild-type vs SRAS1.1-14), <0.0001 (wild-type vs SRAS1.1-26), <0.0001 (wild-type vs sras1.1), 0.4869 (SRAS1.1-14 vs SRAS1.1-26), <0.0001 (SRAS1.1-14 vs sras1.1), <0.0001 (SRAS1.1-26 vs sras1.1). (The following is the same order). (F) P values < 0.0001, <0.0001, <0.0001, <0.0001, <0.0001, <0.0001. (G) Morphology of seedlings before and after drought stress treatment. 2-week-old wild-type, SRAS1.1-OE, and sras1.1 mutant plants were subjected to drought stress for 16 days and then rewatered for 5 days. Scale bars = 2 cm. (H) Survival rate after drought treatment. Values shown are means ± SD (n = 3 biological replicates). P values = 0.0032 (wild-type vs SRAS1.1-14), 0.038 (wild-type vs SRAS1.1-26), 0.0001 (wild-type vs sras1.1), 0.2931 (SRAS1.1-14 vs SRAS1.1-26), <0.0001 (SRAS1.1-14 vs sras1.1), <0.0001 (SRAS1.1-26 vs sras1.1). (I) Water loss rate in detached leaves of 3-week-old wild-type, SRAS1.1-OE, and sras1.1 mutant plants. Values shown are means ± SD (n = 3 biological replicates), with 10 detached leaves analyzed per replicate. Significance was determined using Student’s t test. T = 2 h: P values = 0.0929 (wild-type vs SRAS1.1-14), 0.3045 (wild-type vs SRAS1.1-26), 0.1631 (wild-type vs sras1.1). (The following is the same order). T = 4 h: P values = 0.0651, 0.1448, 0.0414. T = 6 h: P values = 0.0361, 0.1401, 0.2472. T = 8 h: P values = 0.0112, 0.1813, 0.1428. T = 10 h: P values = 0.0012, 0.0054, 0.0149. T = 12 h: P values = 0.0219, 0.0201, 0.0739. (J) Representative images of stomata in wild-type, SRAS1.1-OE, and sras1.1 mutants after drought stress. Scale bars = 20 μm. (K) Quantification of stomatal closure in different genotypes shown in (J). Values shown are means ± SD (n = 3 biological replicates), with 20 plants analyzed per replicate. P values < 0.0001 (wild-type vs SRAS1.1-14), <0.0001 (wild-type vs SRAS1.1-26), <0.0001 (wild-type vs sras1.1), 0.078 (SRAS1.1-14 vs SRAS1.1-26), <0.0001 (SRAS1.1-14 vs sras1.1), <0.0001 (SRAS1.1-26 vs sras1.1). (L) Quantitative measurement of the expression levels of SLAC1. The data were normalized against UBQ10 expression. Values shown are means ± SD (n = 3 biological replicates). P values = 0.0031 (wild-type vs SRAS1.1-14), 0.0073 (wild-type vs SRAS1.1-26), <0.0001 (wild-type vs sras1.1), 0.8888 (SRAS1.1-14 vs SRAS1.1-26), <0.0001 (SRAS1.1-14 vs sras1.1), <0.0001 (SRAS1.1-26 vs sras1.1). Data information: For (A, C, I) values shown are means ± SD. Asterisks represent significant differences determined by Student’s t test (*P < 0.05; **P < 0.01). For (E, F, H, K, L) different lowercase letters represent significant differences, as determined by one-way ANOVA in combination with Tukey’s multiple comparisons test (P < 0.05). Data in (E, F, K) are plotted with box–whisker plots: the whiskers represent maximum and minimum values, and boxes represent the upper quartile, median, and lower quartile, dots represent data points. Source data are available online for this figure.
Figure 2
Figure 2. SRAS1.1 mutation enhances drought-responsive gene expression.
(A, B) Volcano plots illustrating the distribution of differentially expressed genes (DEGs) in sras1.1 mutants (A) and SRAS1.1-14 (B) compared to wild-type, with upregulated (red) and downregulated (green) genes. Differential expression was analyzed using DESeq2. Genes with an adjusted P value (FDR) < 0.01 and |log2(fold change)| > 1 were defined as significantly differentially expressed.The volcano plot shows −log10(P value) versus log2(fold change). Data are based on three independent biological replicates (n = 3). (C) Heatmap showing hierarchical clustering of DEGs in wild-type, sras1.1 mutants and SRAS1.1-14 plants. Colors represent normalized gene expression values. (D) Gene Ontology (GO) enrichment analysis of DEGs in sras1.1 mutants and SRAS1.1-14 compared to wild-type after 6 h of 250 mM mannitol treatment. Circle size represents the number of enriched genes, and circle color denotes enrichment significance. (E) Kyoto Encyclopedia of Genes and Genomes (KEGG) enrichment analysis of DEGs in sras1.1 mutants and SRAS1.1-14 compared to wild-type after 6 h of 250 mM mannitol treatment. Circle size indicates the number of enriched genes, and color represents enrichment significance. (F–I) Quantitative measurement of the expression levels of drought-responsive genes RD20 (F), RD22 (G), WRKY54 (H), WRKY70 (I). Expression levels were normalized to UBQ10. Values shown are means ± SD (n = 3 biological replicates). Statistical analysis was performed using one-way ANOVA followed by Tukey’s multiple comparisons test. Different lowercase letters indicate significant differences (P < 0.05). (F) P values = 0.0052 (wild-type vs SRAS1.1-14), 0.0128 (wild-type vs SRAS1.1-26), <0.0001 (wild-type vs sras1.1), 0.8928 (SRAS1.1-14 vs SRAS1.1-26), <0.0001 (SRAS1.1-14 vs sras1.1), <0.0001 (SRAS1.1-26 vs sras1.1). (The following is the same order). (G) P values = 0.017, 0.017, <0.0001, >0.9999, <0.0001, <0.0001. (H) P values < 0.0001, <0.0001, 0.0066, 0.0099, <0.0001, <0.0001. (I) P values < 0.0001, <0.0001, 0.009, 0.0362, <0.0001, <0.0001. Source data are available online for this figure.
Figure 3
Figure 3. SRAS1.1 selectively interacts with DSK2A.
(A) Yeast two-hybrid (Y2H) analysis confirmed the interaction between SRAS1.1 and both DSK2A and DSK2B. Interaction between empty AD and BD vectors was used as a negative control. (B, C) Luciferase complementation imaging assay (LCI) (B) and LUC activity measurement (C) showed that SRAS1.1 interacts with DSK2A and DSK2B. Interaction between empty cLUC vector was used as a negative control. Values shown are means ± SD (n = 5 biological replicates). Statistical analysis was performed using one-way ANOVA followed by Tukey’s multiple comparisons test. Different lowercase letters indicate significant differences (P < 0.05). P values < 0.0001 (nLUC-DSK2B + SRAS1.1-cLUC vs nLUC-DSK2A + SRAS1.1-cLUC), <0.0001 (nLUC-DSK2B + SRAS1.1-cLUC vs nLUC-DSK2B + cLUC), <0.0001 (nLUC-DSK2B + SRAS1.1-cLUC vs nLUC-DSK2A + cLUC), <0.0001 (nLUC-DSK2A + SRAS1.1-cLUC vs nLUC-DSK2B + cLUC), <0.0001 (nLUC-DSK2A + SRAS1.1-cLUC vs nLUC-DSK2A + cLUC), 0.9521 (nLUC-DSK2B + cLUC vs nLUC-DSK2A + cLUC). (D) Co-immunoprecipitation (Co-IP) assay showing the interaction of SRAS1.1 with DSK2A and DSK2B in vivo. Immunoprecipitated proteins were analyzed by immunoblotting using anti-GFP and anti-HA antibodies. (E) Bimolecular fluorescence complementation (BiFC) assay visualized interactions between SRAS1.1 and DSK2A/DSK2B. YFP signals are detected in both the nucleus and cytoplasm for SRAS1.1-DSK2A, and predominantly in the cytoplasm for SRAS1.1-DSK2B. The interaction between SRAS1.1 and empty nYFP-ABI5 was used as a negative control, and nYFP-CSN5A as a positive control. Scale bars = 20 μm. Source data are available online for this figure.
Figure 4
Figure 4. SRAS1.1 specifically ubiquitinates and promotes the degradation of DSK2A.
(A) Western blot analysis of DSK2A and DSK2B protein abundance in wild-type, SRAS1.1-OE, and sras1.1 mutant seedlings. To demonstrate the specificity of the Anti-DSK2 antibody, ACTIN was used as a loading control. (B) In vitro ubiquitination assay showed that DSK2A-His protein can be ubiquitinated by GST-SRAS1.1. Recombinant proteins DSK2A-His, DSK2B-His, and GST-SRAS1.1 purified from E. coli were assayed. Reaction products were analyzed by immunoblotting with Anti-MYC and Anti-GST. (C, D) Degradation rates of DSK2A-His (C) and DSK2B-His (D) were assessed in cell-free degradation assay using wild-type, SRAS1.1-14 and sras1.1 protein extracts. Recombinant purified DSK2A-His and DSK2B-His were added to the protein extracts and incubated for 1, 2, or 3 h. Protein abundance was determined with anti-His antibody. Similar results were obtained in 3 independent experiments. (E, F) Linear regressions of the quantified band intensities from (C, D) by ImageJ representing the degradation rates of DSK2A (E) and DSK2B (F) in wild-type, SRAS1.1-14 and sras1.1 protein extracts. Y0.5 represents the time point at which half of the protein was degraded. Similar results were obtained from three independent experiments. Each figure panel displays a representative image obtained from a gel-based assay. All plant materials were compared with wild-type separately. Values shown are means ± SD (n = 3 biological replicates). All comparisons were made to wild-type plants. Statistical significance was determined using Student’s t test (E) T = 1 h: P values = 0.2188 (wild-type vs SRAS1.1-14), 0.3464 (wild-type vs sras1.1). (The following is the same order). T = 2 h: P values = 0.0625, 0.0453. T = 3 h: P values = 0.0789, 0.0041. (F) T = 1 h: P values = 0.953, 0.1862. T = 2 h: P values = 0.3096, 0.0148. T = 3 h: P values = 0.6692, 0.1699. Data information: Values are presented as means ± SD (n = 3 biological replicates). All comparisons were made to wild-type plants. Statistical significance was determined using Student’s t test (*P < 0.05; **P < 0.01). Source data are available online for this figure.
Figure 5
Figure 5. DSK2A is epistatic to SRAS1.1 under drought stress.
(A) Root growth phenotype of seedlings with the indicated genotypes grown on 1/2 MS medium with or without 250 mM mannitol for 14 days. Scale bars = 1 cm. (B, C) Relative primary root length (B) and lateral root density (C) of seedlings shown in (A), expressed relative to the wild-type (set to 1). Values shown are means ± SD (n = 3 biological replicates), with 10 plants analyzed per replicate. (B) P values < 0.0001 (wild-type vs SRAS1.1-14), <0.0001 (wild-type vs sras1.1), <0.0001 (wild-type vs dsk2b), <0.0001 (wild-type vs dsk2a), <0.0001 (wild-type vs sras1.1 dsk2a), <0.0001 (wild-type vs sras1.1 dsk2b), <0.0001 (SRAS1.1-14 vs sras1.1), <0.0001 (SRAS1.1-14 vs dsk2b), 0.9882 (SRAS1.1-14 vs dsk2a), >0.9999 (SRAS1.1-14 vs sras1.1 dsk2a), <0.0001 (SRAS1.1-14 vs sras1.1 dsk2b), 0.12 (sras1.1 vs dsk2b), <0.0001 (sras1.1 vs dsk2a), <0.0001 (sras1.1 vs sras1.1 dsk2a), 0.5569 (sras1.1 vs sras1.1 dsk2b), <0.0001 (dsk2b vs dsk2a), <0.0001 (dsk2b vs sras1.1 dsk2a), 0.9732 (dsk2b vs sras1.1 dsk2b), 0.9942 (dsk2a vs sras1.1 dsk2a), <0.0001 (dsk2a vs sras1.1 dsk2b), <0.0001 (sras1.1 dsk2a vs sras1.1 dsk2b). (The following is the same order). (C) P values < 0.0001, 0.0435, 0.0482, <0.0001, <0.0001, 0.0325, <0.0001, <0.0001, 0.0554, 0.0912, <0.0001, >0.9999, <0.0001, <0.0001, >0.9999, <0.0001, <0.0001, >0.9999, >0.9999, <0.0001, <0.0001. (D) Drought tolerance assay in soil. Wild-type, SRAS1.1-14, sras1.1, dsk2b, dsk2a, sras1.1 dsk2b, and sras1.1 dsk2a plants grown under normal growth conditions for 2 weeks were subjected to drought stress for 16 days and then rewatered for 5 days. Scale bars = 2 cm. (E, F) Survival rates of seedlings following re-watering (E) and water loss rates (F) in detached leaves. Values shown are means ± SD (n = 3 biological replicates). (E) P values = 0.0061 (wild-type vs SRAS1.1-14), <0.0001 (wild-type vs sras1.1), 0.0031 (wild-type vs dsk2b), 0.0005 (wild-type vs dsk2a), 0.0015 (wild-type vs sras1.1 dsk2a), 0.0005 (wild-type vs sras1.1 dsk2b), <0.0001 (SRAS1.1-14 vs sras1.1), <0.0001 (SRAS1.1-14 vs dsk2b), 0.7951 (SRAS1.1-14 vs dsk2a), 0.9833 (SRAS1.1-14 vs sras1.1 dsk2a), <0.0001 (SRAS1.1-14 vs sras1.1 dsk2b), 0.0076 (sras1.1 vs dsk2b), <0.0001 (sras1.1 vs dsk2a), <0.0001 (sras1.1 vs sras1.1 dsk2a), 0.0475 (sras1.1 vs sras1.1 dsk2b), <0.0001 (dsk2b vs dsk2a), <0.0001 (dsk2b vs sras1.1 dsk2a), 0.9266 (dsk2b vs sras1.1 dsk2b), 0.9949 (dsk2a vs sras1.1 dsk2a), <0.0001 (dsk2a vs sras1.1 dsk2b), <0.0001 (sras1.1 dsk2a vs sras1.1 dsk2b). (F) T = 2 h: P values = 0.1829 (wild-type vs SRAS1.1-14), 0.9304 (wild-type vs sras1.1), 0.1731 (wild-type vs dsk2b), 0.2222 (wild-type vs dsk2a), 0.0539 (wild-type vs sras1.1 dsk2a), 0.0657 (wild-type vs sras1.1 dsk2b). (The following is the same order). T = 4 h: P values = 0.366, 0.4193, 0.4, 0.0038, 0.031, 0.7369. T = 6 h: P values = 0.0179, 0.2469, 0.2509, 0.0062, 0.016, 0.0748. T = 8 h: P values = 0.2951, 0.0178, 0.0516, 0.0039, 0.0127, 0.109. T = 10 h: P values = 0.0012, 0.0015, 0.0421, <0.0001, 0.0012, 0.0343. T = 12 h: P values = 0.0328, 0.0253, 0.0587, 0.0072, 0.0019, 0.0108. (G) Degradation rates of DSK2A in 35S:DSK2A-GFP, and 35S:DSK2A-GFP/sras1.1 seedlings treated with or without mannitol and MG132. Seedlings were treated with 200 μM CHX, 200 μM CHX + 250 mM mannitol or 200 μM CHX + 100 μM MG132 for 3, 6, or 9 h. CHX cycloheximide. Similar results were obtained from three independent experiments. Each figure panel displays a representative image obtained from a gel-based assay. (H, I) Linear regressions of the quantified band intensities from (G) by ImageJ representing the degradation rates of DSK2A-GFP in 35S:DSK2A-GFP (H), and 35S:DSK2A-GFP/sras1.1 (I) with or without mannitol and MG132 treatment. Y0.5 represents the time point at which half of the 35S:DSK2A-GFP protein was degraded. All groups were compared with 35S:DSK2A-GFP separately. Values shown are means ± SD (n = 3 biological replicates). (H) T = 3 h: P values = 0.0077 (CHX vs CHX + Mannitol), 0.0014 (CHX vs CHX + MG132). (The following is the same order). T = 6 h: P values = 0.098, 0.0015. T = 9 h: P values = 0.0267, 0.0002. (I) T = 3 h: P values = 0.0016, <0.0001. T = 6 h: P values = 0.0051, <0.0001. T = 9 h: P values = 0.0069, 0.0003. Data information: For (B, C, E) different lowercase letters represent significant differences, as determined by one-way ANOVA in combination with Tukey’s comparisons test, (P < 0.05). Data in (B, C) are plotted with box–whisker plots: the whiskers represent maximum and minimum values, and boxes represent the upper quartile, median, and lower quartile, dots represent data points. For (F, H, I) asterisks represent significant differences determined by Student’s t test (*P < 0.05; **P < 0.01; ***P < 0.001). Source data are available online for this figure.
Figure 6
Figure 6. SRAS1.1 activates drought stress-induced autophagy.
(A) Localization of transiently expressed 35S:SRAS1.1-GFP. Confocal microscopy of N. benthamiana transfected with 35S:SRAS1.1-GFP, grown under light for 2 days, then placed in liquid medium supplemented with 250 mM mannitol and 10 μM ConA for 6 h, and then observed by confocal laser scanning microscopy. The arrows indicate SRAS1.1-GFP spots. ConA, concanamycin A. Scale bars = 20 μm. (B) Confocal analysis of GFP-ATG8e/WT, and GFP-ATG8e/sras1.1 lines. Five-day-old seedlings were exposed to 250 mM mannitol liquid medium and then visualized by confocal laser scanning microscopy. The arrows indicate autophagic bodies. Scale bars = 10 μm. (C) Numbers of puncta per section in the root cells of the GFP-ATG8e/WT, and GFP–ATG8e/sras1.1 in (B). Values shown are means ± SD (n = 3 biological replicates), with 10 plants analyzed per replicate. Significance was determined using Student’s t test. Mock: P values = 0.3855 (GFP-ATG8e/WT vs GFP-ATG8e/sras1.1). 10 min: P values = 0.0078. 30 min: P values = 0.0028. (D, E) Relative expression of autophagy‐related genes ATG5 (D) and ATG7 (E) gene by qRT-PCR analysis normalized to UBQ10 levels in 14-day-old Arabidopsis grown for 16 days on 1/2 MS with or without 250 mM mannitol. Values shown are means ± SD (n = 3 biological replicates). (D) Mock: P values = 0.8339 (wild-type vs SRAS1.1-14), >0.9999 (wild-type vs SRAS1.1-26), 0.2346 (wild-type vs sras1.1), 0.8558 (SRAS1.1-14 vs SRAS1.1-26), 0.0749 (SRAS1.1-14 vs sras1.1), 0.2236 (SRAS1.1-26 vs sras1.1). (The following is the same order). Mannitol: P values = 0.0258, 0.1442, 0.0037, 0.6271, <0.0001, 0.0003. (E) Mock: P values = 0.9928, 0.9986, 0.0694, 0.9731, 0.1013, 0.0558. Mannitol: P values = 0.3984, 0.469, <0.0001, 0.9988, <0.0001, <0.0001. (F) Western blot analysis of BES1 protein levels in wild-type, SRAS1.1-14, SRAS1.1-26, and sras1.1 mutants. ACTIN was used as a loading control. Similar results were obtained from three independent experiments. Each figure panel displays a representative image obtained from a gel-based assay. (G) Model in which SRAS1.1 promotes the degradation of DSK2A to ensure the stability of BES1 protein. Drought stress leads to the accumulation of DSK2A, which in turn promotes the degradation of BES1, balancing the growth and development of plants. Data information: For (C) significance was determined using Student’s t test. For (D, E) different lowercase letters represent significant differences, as determined by one-way ANOVA in combination with Tukey’s multiple comparisons test (P < 0.05). Source data are available online for this figure.
Figure EV1
Figure EV1. The effects of SRAS1.1 on Arabidopsis drought tolerance.
(A–C) Representative seedlings of wild-type, SRAS1.1-14, sras1.1 mutants and proSRAS1.1:SRAS1.1/sras1.1 complementation line (COM1) after 14 days of growth in 1/2 MS medium with or without 250 mM mannitol. Scale bars = 1 cm. Primary root length (B) and lateral root density (C) of seedlings shown in (A). Values represent means ± SD (n = 3 biological replicates), with 20 plants analyzed per replicate. (B) P values < 0.0001 (wild-type vs SRAS1.1-14), <0.0001 (wild-type vs sras1.1), 0.0217 (wild-type vs COM1), <0.0001 (SRAS1.1-14 vs sras1.1), <0.0001 (SRAS1.1-14 vs COM1) < 0.0001 (sras1.1 vs COM1). (The following is the same order). (C) P values < 0.0001, < 0.0001, 0.8803, <0.0001, < 0.0001, 0.0013. (D–I) Phenotypic analysis of wild-type, SRAS1.1-OE, sras1.1 mutants, and COM1 seedlings grown on 1/2 MS medium with or without 250 mM mannitol (D, G). Images were taken 7 days after germination. Comparison of germination rates under normal conditions (E, H) and 250 mM mannitol treatment (F, I) between wild-type and transgenic plants. Values shown are means ± SD (n = 3 biological replicates). Significance was determined using Student’s t test. (E) T = 24 h: P values > 0.9999 (wild-type vs SRAS1.1-14), >0.9999 (wild-type vs SRAS1.1-26), 0.9984 (wild-type vs sras1.1). (The following is the same order). T = 48 h: P values = 0.9999, 0.1836, >0.9999. T = 72 h: P values > 0.9999, >0.999, >0.9999. (F) T = 24 h: P values > 0.9999, >0.9999, >0.9999. T = 48 h: P values > 0.9999, >0.9999, >0.9999. T = 72 h: P values = 0.0092, 0.6742, 0.0476. T = 96 h: P values = 0.0067, 0.0083, 0.0347. T = 120 h: P values = 0.0044, 0.0057, 0.0433. T = 144 h: P values < 0.0001, <0.0001, 0.0191. T = 168 h: P values < 0.0001, <0.0001, 0.0207. (H) T = 24 h: P values = 0.6449 (wild-type vs SRAS1.1-14), 0.7372 (wild-type vs sras1.1), 0.0927 (wild-type vs COM1). (The following is the same order). T = 48 h: P values > 0.9999, 0.8942, 0.3219. T = 72 h: P values > 0.9999, >0.9999, >0.9999. (I) T = 24 h: P values > 0.9999, >0.9999, >0.9999. T = 48 h: P values > 0.9999, >0.9999, >0.9999. T = 72 h: P values = 0.0039, 0.0652, >0.9999. T = 96 h: P values = 0.0058, 0.0476, 0.7557. T = 120 h: P values = 0.0012, 0.0074, 0.9801. T = 144 h: P values = 0.0007, 0.0386, 0.9817. T = 168 h: P values < 0.0001, 0.0217, >0.9999. (JM) Quantitative expression analysis of DREB2A (J), RD20 (K), RD29A (L), and RD26 (M). The data were normalized against UBQ10 expression. Values shown are means ± SD (n = 3 biological replicates). (J) P values = 0.0212 (wild-type vs SRAS1.1-14), 0.0473 (wild-type vs SRAS1.1-26), <0.0001 (wild-type vs sras1.1), 0.9217 (SRAS1.1-14 vs SRAS1.1-26) < 0.0001 (SRAS1.1-14 vs sras1.1), <0.0001 (SRAS1.1-26 vs sras1.1). (The following is the same order). (K) P values < 0.0001, <0.0001, <0.0001, 0.4539, <0.0001, <0.0001. (L) P values < 0.0001, <0.0001, <0.0001, 0.127, <0.0001, <0.0001. (M) P values = 0.0024, 0.0016, <0.0001, >0.9999, <0.0001, <0.0001. Data information: For (B, C, JM) different lowercase letters represent significant differences, as determined by one-way ANOVA in combination with Tukey’s multiple comparisons test (P < 0.05). For (E, F, H, I) significance was determined using Student’s t test.
Figure EV2
Figure EV2. Overexpression of SRAS1.1 promotes flowering in Arabidopsis.
(A) Morphology of wild-type and SRAS1.1-14, SRAS1.1-26, and sras1.1 mutants at the flowering stage under control and drought conditions. Scale bars = 2 cm. (B, C) Total leaf number at flowering (B) and days to flowering (C) in wild-type, SRAS1.1-14, SRAS1.1-26, and sras1.1 mutants grown with and without drought treatment. Data in (B, C) are plotted with box–whisker plots: the whiskers represent maximum and minimum values, and boxes represent the upper quartile, median, and lower quartile, dots represent data points. (B) Mock: P values < 0.0001 (wild-type vs SRAS1.1-14), <0.0001 (wild-type vs SRAS1.1-26), 0.0021 (wild-type vs sras1.1), 0.0917 (SRAS1.1-14 vs SRAS1.1-26), <0.0001 (SRAS1.1-14 vs sras1.1), <0.0001 (SRAS1.1-26 vs sras1.1). (The following is the same order). Drought: P values < 0.0001, <0.0001, <0.0001, 0.4112, <0.0001, <0.0001. (C) Mock: P values = 0.0016, 0.0452, 0.0274, 0.5916, <0.0001, <0.0001. Drought: P values = 0.4801, 0.3633, <0.0001, 0.9968, <0.0001, < 0.0001. (D) Analysis of pollen grains from wild-type, SRAS1.1-14, SRAS1.1-26, and sras1.1 mutants using alexander staining, fluorescein diacetate (FDA) staining, and scanning electron microscopy (SEM), respectively. (E, F) Number of FDA-stained pollen grains per 1 mm2 (E), in vitro pollen germination rates (F) of wild-type, SRAS1.1-14, SRAS1.1-26, and sras1.1 mutants. Values represent means ± SD (n = 3 biological replicates), with 10 plants analyzed per replicate. (E) P values < 0.0001 (wild-type vs SRAS1.1-14), 0.0104 (wild-type vs SRAS1.1-26), 0.0037 (wild-type vs sras1.1), 0.0297 (SRAS1.1-14 vs SRAS1.1-26), <0.0001 (SRAS1.1-14 vs sras1.1), <0.0001 (SRAS1.1-26 vs sras1.1). (The following is the same order). (F) P values < 0.0001, <0.0001, 0.4716, 0.0576, <0.0001, <0.0001. (G–J) Quantitative expression analysis of FT (G), CO (H), SOC1 (I), and LFY (J). The data were normalized against UBQ10 expression. Values shown are means ± SD (n = 3 biological replicates). (G) P values < 0.0001 (wild-type vs SRAS1.1-14), <0.0001 (wild-type vs SRAS1.1-26), 0.0055 (wild-type vs sras1.1), 0.4145 (SRAS1.1-14 vs SRAS1.1-26), <0.0001 (SRAS1.1-14 vs sras1.1), <0.0001 (SRAS1.1-26 vs sras1.1). (The following is the same order). (H) P values = 0.0002, <0.0001, 0.0313, 0.0711, <0.0001, <0.0001. (I) P values = 0.0011, 0.0003, 0.0389, 0.616, 0.0004, 0.0001. (J) P values < 0.0001, <0.0001, 0.0099, 0.1706, <0.0001, <0.0001. Data information: For (B, C, E, F, GJ) different lowercase letters represent significant differences, as determined by one-way ANOVA in combination with Tukey’s multiple comparisons test (P < 0.05).
Figure EV3
Figure EV3. DSK2A is ubiquitinated by SRAS1.1, and Lys68 is the major ubiquitination site.
(A) Ubiquitination of DSK2A-GFP and DSK2B-GFP in wild-type and sras1.1 plants, detected in an Arabidopsis protoplast transient transformation assay. Anti-GFP antibody was used to immunoprecipitate DSK2A-GFP and DSK2B-GFP, and anti-MYC antibody was used to detect Ubiquitin-MYC. (B) Amino acid sequence of DSK2A with lysine residues highlighted in red. (C) Predicted post-translational modifications of DSK2A, with Lys68 indicated as the major ubiquitination site. (D) Degradation rates of DSK2A-His, DSK2AK68R-His, and DSK2AK29R-His in cell-free degradation assays using protein extracts from wild-type, SRAS1.1-14, and sras1.1 mutant plants. Proteins were detected by immunoblotting with an anti-His antibody. Ponceau S staining was used as a loading control. (E–G) Quantified degradation rates of DSK2A-His (E), DSK2AK68R-His (F), and DSK2AK29R-His (G) plotted as linear regression curves. Y0.5 denotes the time required for 50% degradation. Values shown are means ± SD (n = 3 biological replicates). All comparisons were made against DSK2A-His and analyzed by linear regression and Student’s t test (*P < 0.05; **P < 0.01; ***P < 0.001). (E) T = 1 h: P values = 0.0273 (DSK2A-His vs DSK2AK68R-His), 0.3123 (DSK2A-His vs DSK2AK29R-His). (The following is the same order). T = 2 h: P values = 0.0009, 0.0433. T = 3 h: P values = 0.0007, 0.0322. (F) T = 1 h: P values = 0.0072, 0.4917. T = 2 h: P values = 0.0005, 0.8971. T = 3 h: P values < 0.0001, 0.3707. (G) T = 1 h: P values = 0.2442, 0.9017. T = 2 h: P values = 0.0074, 0.0981. T = 3 h: P values = 0.0095, 0.0672.
Figure EV4
Figure EV4. SRAS1.1 is involved in the regulation of cellular autophagy.
(A) Confocal analysis of 35S:SRAS1.1-GFP transgenic Arabidopsis. 5-day-old seedlings were exposed to 250 mM mannitol liquid medium for 30 min and then visualized by confocal laser scanning microscopy. Scale bars = 20 μm. (B) Numbers of puncta per section in the root cells of the 35S:SRAS1.1-GFP transgenic Arabidopsis in (A). Values shown are means ± SD (n = 3 biological replicates), with 20 plants analyzed per replicate. P values < 0.0001 (Mock vs Mannitol), <0.0001 (Mock vs Mannitol + ConA), <0.0001 (Mannitol vs Mannitol + ConA). (C) Confocal analysis of 35S:DSK2A-GFP and 35S:DSK2A-GFP/sras1.1 transgenic plants. Five-day-old seedlings were exposed to 250 mM mannitol liquid medium for 30 min and then visualized by confocal laser scanning microscopy. Scale bars = 20 μm. (D) Numbers of puncta per section in the root cells of the transgenic plants in (C). Values shown are means ± SD (n = 3 biological replicates), with 20 plants analyzed per replicate. Significance was determined using Student’s t test. Mock: P values = 0.0312 (35S:DSK2A-GFP vs 35S:DSK2A-GFP/sras1.1). Mannitol: P values = 0.0092. Mannitol + ConA: P values < 0.0001. Data information: For (B) different lowercase letters represent significant differences, as determined by one-way ANOVA in combination with Tukey’s multiple comparisons test (P < 0.05). For (D) significance was determined using Student’s t test.
Figure EV5
Figure EV5. Alternative splicing of SRAS1 in response to drought stress.
(A) Schematic diagram of SRAS1 gene. Two different intron splice sites are indicated in the gene diagram. Arrows (F1 and R1) indicate the location of primers used in RT-PCR and green color represents the exon region; blue region represents the RING domain. (B) RT-PCR analysis of the expression levels of SRAS1.1 and SRAS1.2 at 0, 1, 3, and 6 h after 250 mM mannitol treatment. Elongation factor 1α (EF-1α) was used as an internal control. (C, D) Quantitative measurement of the expression levels of SRAS1.2 (C) and SRAS1.1 (D) in wild-type, SRAS1.2 overexpressing plants (SRAS1.2-1, SRAS1.2-4). UBQ10 was used as an internal control. Values shown are means ± SD (n = 3 biological replicates). (C) P values < 0.0001 (wild-type vs SRAS1.2-1), <0.0001 (wild-type vs SRAS1.2-4), 0.1163 (SRAS1.2-1 vs SRAS1.2-4). (The following is the same order). (D) P values = 0.865, 0.9977, 0.8333. (E–G) Representative seedlings of wild-type, SRAS1.2-1, and SRAS1.2-4 after 10 days of growth in 1/2 MS medium with or without 250 mM mannitol. Scale bars = 1 cm. Primary root length (F) and lateral root density (G) of seedlings shown in (E). Values shown are means ± SD (n = 3 biological replicates), with 20 plants analyzed per replicate. (F) P values = 0.6465 (wild-type vs SRAS1.2-1), 0.9411 (wild-type vs SRAS1.2-4), 0.8409 (SRAS1.2-1 vs SRAS1.2-4). (The following is the same order). (G) P values = 0.7984, 0.1795, 0.4835. Data information: For (C, D, F, G) different lowercase letters represent significant differences, as determined by one-way ANOVA in combination with Tukey’s multiple comparisons test (P < 0.05).

References

    1. Bao Y, Song WM, Wang P, Yu X, Li B, Jiang C, Shiu SH, Zhang H, Bassham DC (2020) COST1 regulates autophagy to control plant drought tolerance. Proc Natl Acad Sci USA 117:7482–7493 - PMC - PubMed
    1. Cai J, Zhang Y, He R, Jiang L, Qu Z, Gu J, Yang J, Legascue MF, Wang ZY, Ariel F et al (2024) LncRNA DANA1 promotes drought tolerance and histone deacetylation of drought responsive genes in Arabidopsis. EMBO Rep 25:796–812 - PMC - PubMed
    1. Chen Q, Liu RJ, Wu YR, Wei SW, Wang Q, Zheng YN, Xia R, Shang XL, Yu FF, Yang XY et al (2021a) ERAD-related E2 and E3 enzymes modulate the drought response by regulating the stability of PIP2 aquaporins. Plant Cell 33:2883–2898 - PMC - PubMed
    1. Chen RH, Chen YH, Huang TY (2019) Ubiquitin-mediated regulation of autophagy. J Biomed Sci 26:80 - PMC - PubMed
    1. Chen X, Wang T, Rehman AU, Wang Y, Qi J, Li Z, Song C, Wang B, Yang S, Gong Z (2021b) Arabidopsis U-box E3 ubiquitin ligase PUB11 negatively regulates drought tolerance by degrading the receptor-like protein kinases LRR1 and KIN7. J Integr Plant Biol 63:494–509 - PubMed

Substances

LinkOut - more resources