. 2025 Aug 22;17(1):144.
doi: 10.1186/s13148-025-01956-3.

Landscape analysis of m5C modification regulators unveils DNMT1-mediated dysregulated pyrimidine metabolism in hepatocellular carcinoma

Affiliations

Landscape analysis of m5C modification regulators unveils DNMT1-mediated dysregulated pyrimidine metabolism in hepatocellular carcinoma

Xuhui Zhao et al. Clin Epigenetics. .

Abstract

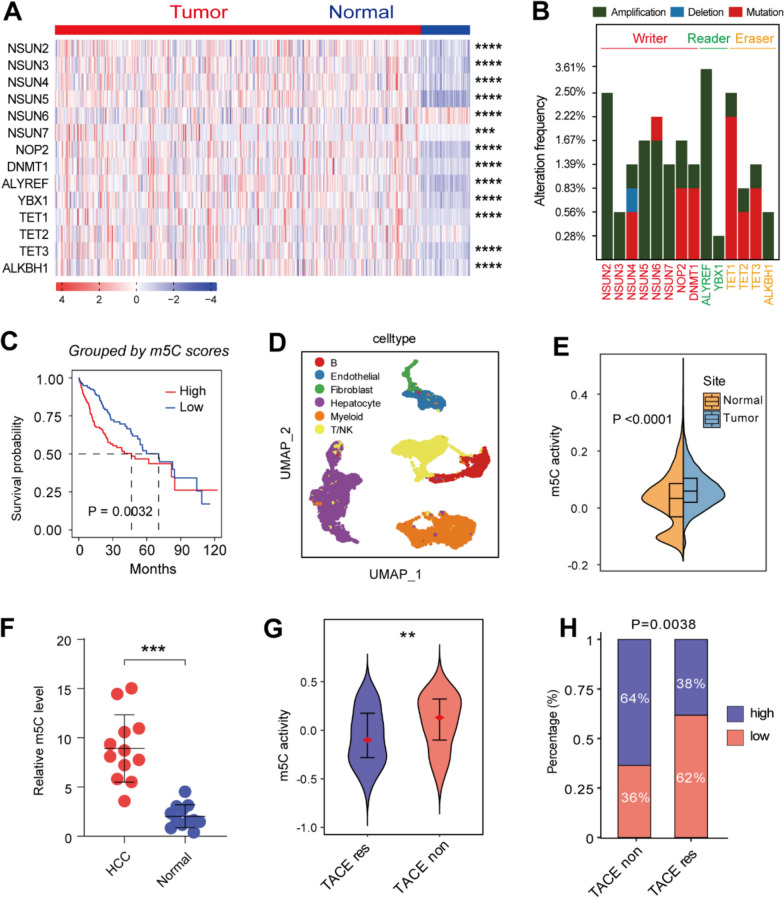
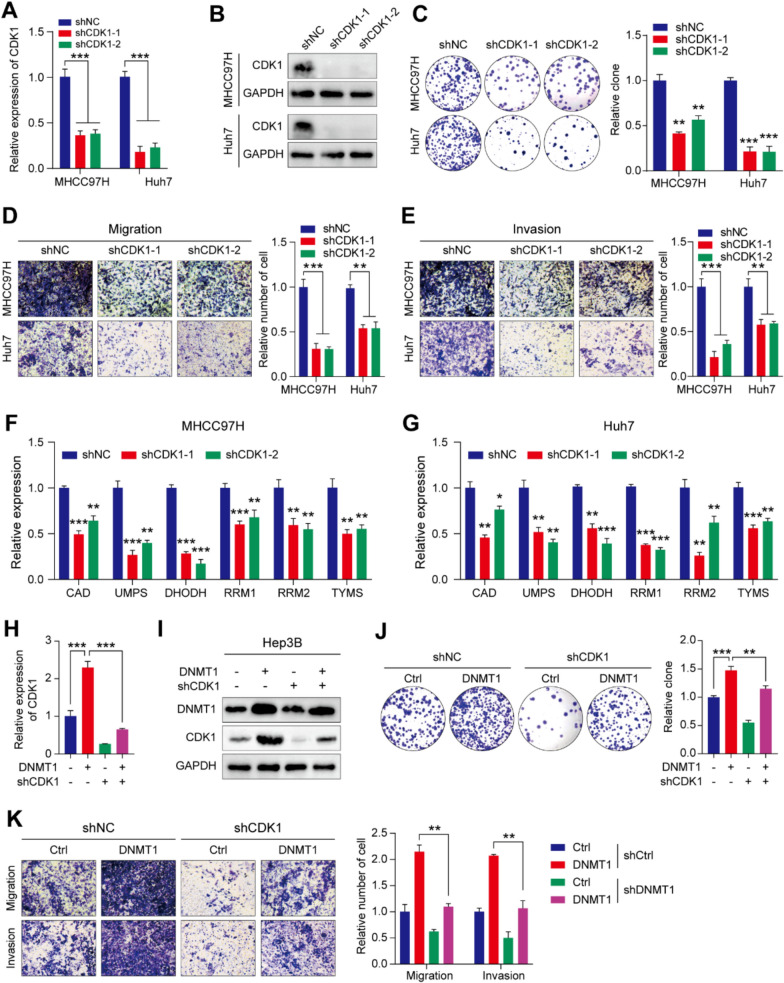
The 5-methylcytosine (m5C) post-transcriptional modification has been linked with the development and progression of a variety of cancers. However, its specific functions and their underlying mechanisms are poorly understood in hepatocellular carcinoma (HCC). The present study showed abnormally increased levels of m5C modifications in HCC that were positively correlated with both HCC progression and worse patient prognosis. Landscape profiling of metabolic characteristics showed dysregulation of pyrimidine metabolism mediated by DNA methyltransferases 1 (DNMT1), and cyclin-dependent kinase 1 (CDK1) was identified as a downstream effector upregulated by DNMT1 in an m5C-dependent manner, with CDK1 promoting pyrimidine metabolism. Knockdown of DNMT1 or CDK1 was found to reduce the proliferation, invasion, and migration of HCC cells in vitro. Moreover, pharmacological targeting of the DNMT1/CDK1/pyrimidine metabolism axis with specific inhibitors effectively suppressed tumor progression in HCC model mice. These findings demonstrated the landscape profiles of m5C-related metabolic features in HCC, showing stabilization of CDK1 mRNA by DNMT1-mediated m5C modification, resulting in the promotion of pyrimidine metabolism, a crucial feature of HCC progression. These insights highlight the therapeutic potential of targeting the DNMT1/CDK1/pyrimidine metabolism axis as a strategy for combating HCC.

Keywords: Cyclin-dependent protein kinase 1; DNA-methyltransferase 1; HCC; Pyrimidine metabolism; m5C modification.


Conflict of interest statement

Declarations. Conflict of interest: The authors declare no competing interests. Ethics approval and consent to participate: The collection of specimens of clinical patients in this study was approved by the Research Ethics Committee of Zhongshan Hospital. Consent for publication: Not applicable.

Figures

Fig. 1
Fig. 1
Comprehensive profiling of the significance of m5C modification in HCC. A Heatmap showing a comparison of m5C regulator mRNA expression levels between HCC and normal tissues, based on TCGA data. B Frequencies of genetic alterations in m5C regulators. C K–M curve shows significant difference between m5Chigh and m5Clow groups. The threshold score for dividing high and low groups was − 0.559, which was the median score. D UMAP plot of scRNA-seq data from GSE149614. Total cell counts are 16,244. E Comparison of m5C scores between tumor and normal sites in scRNA-seq data. F Comparison of m5C levels in twelve pairs of HCC and normal samples. G Comparison of m5C scores between TACE responders and non-responders. H Stack plot shows proportion of m5Chigh versus m5Clow in responder and non-responder groups. (*P < 0.05, **P < 0.01, ***P < 0.001, ****P < 0.0001)
Fig. 2
Fig. 2
Identification of m5C modification-associated clusters by unsupervised consensus clustering. A Cumulative distribution function (CDF) displays the stability of clustering across k = 2–7. B Delta area plot displays the area under the CDF curve for different k-values, with k = 3 identified as the optimal k-value. C Consensus matrix (k = 3) heatmap demonstrating clustering consistency, with distinct borders indicating distinct and well-defined clustering. D Kaplan–Meier curves indicate distinct differences in OS among the m5C modification clusters. E Comparisons of m5C regulator expression levels in the three m5C clusters. P-values were determined by Kruskal–Wallis tests. F Heatmap showing the differences of multiple signaling pathways and dysregulated metabolism pathways across clusters. Data were analyzed by Kruskal–Wallis tests. (*P < 0.05, **P < 0.01, ***P < 0.001, ****P < 0.0001)
Fig. 3
Fig. 3
Comprehensive profiling of the metabolic characteristics of the m5C clusters showed that DNMT1 mediated dysregulated pyrimidine metabolism. A The process of pyrimidine biosynthesis, from materials to DNA synthesis. Key enzymes are shown in red. B Comparisons of GSVA scores of pyrimidine metabolism. C Z-scores of mean expressions of key enzymes of pyrimidine biosynthesis. D Ranks of fold change of m5C regulators in cluster1. E Differences in m5C regulator expression levels in clinical samples of HCC and normal tissues. DNMT1 exhibited most distinct difference. F Relative expression of DNMT1 in six HCC cell lines. G, H DNMT1 expression levels after DNMT1 knockdown in MHCC97H and Huh7 cells, shown by RT-PCR (E) and western blotting (F). I Comparison of relative m5C levels between the control and DNMT1-knockdown groups. J, K Comparison of key pyrimidine metabolism-associated regulators expression between the control and DNMT1-knockdown groups, shown by RT-PCR (J) and WB (K). L Heatmap showing changes in metabolites of pyrimidine metabolism between control and DNMT1 knockdown group. M, N Colony formation assay and transwell assay results showing colony formation (K) in Huh7 and MHCC97H cells, as well as migration and invasion in MHCC97H cells (L) after DNMT1 knockdown. (*P < 0.05, ** P < 0.01, ***P < 0.001)
Fig. 4
Fig. 4
Discovery of fundamental genes related to clusters with highest m5C levels. A Hierarchical clustering of genes, with different gene modules represented by different colors. B Clustering of different gene modules. C Heatmap showing correlations between gene modules and m5C clusters. The turquoise module is associated predominantly with cluster 1. D Protein–protein interaction network illustrating the hub genes associated with m5C regulators and five genes strongly linked to cluster 1 (unrelated interactions are omitted). E Kaplan–Meier curves comparing the high- and low-expression groups, shown in red and blue, respectively. F Spearman correlation analysis indicating significant associations between the expression of the five genes and DNMT1
Fig. 5
Fig. 5
DNMT1 upregulates CDK1 via m5C modifications. A Comparison of the distribution of m5C modification sites in HCC cells between the control and DNMT1-knockdown groups. B m5C motifs on CDK1. C Venn diagram showing genes common to the m5C MeRIP-seq, RNA-seq, and WGCNA results. D, E Relative expression of CDK1, KIF4A, and TPX2 mRNA (D) and protein (E) levels after DNMT1 knockdown in two cell lines. F, G Western blot results (F) and RT-PCR measurements of the relative protein and mRNA expression, respectively, of CDK1 (G) showing that CDK1 levels were markedly reduced after DNMT1 knockdown. H m5C-IP results showing the m5C peaks in CDK1 mRNA. I Relative CDK1 fold enrichment after DNMT1 knockdown. J, K Comparison of CDK1 expression between tumor and normal tissues in the TCGA-LIHC cohort (J) and between normal and HCC tissues (K). L, M Analysis of CDK1 mRNA stability after DNMT1 knockdown and actinomycin D treatment. N, O Spearman correlations between DNMT1 and CDK1 expression in two GEO datasets GSE76427 (N) and GSE54236 (O). (*P < 0.05, ** P < 0.01, ***P < 0.001)
Fig. 6
Fig. 6
DNMT1 indirectly promotes pyrimidine metabolism via upregulation of CDK1 expression, promoting HCC progression. A mRNA expression of CDK1 following CDK1 knockdown in two HCC cell lines, shown by RT-PCR. B Protein levels of CDK1 following CDK1 knockdown, shown by Western blotting. C Colony formation in the CDK1-knockdown groups vs. the control group in two HCC cell lines. D, E Transwell assay results showing the migration and invasion abilities of HCC cell lines. F, G RT-PCR results showing reduced expression of pyrimidine metabolism-related genes after knockdown of CDK1. H Rescue experiment showing increased CDK1 expression levels following DNMT1 overexpression. I Western blotting showing protein expression of CDK1 under different treatments. J Colony formation in DNMT1-overexpressing cells. K Transwell assay results showing migration and invasion abilities of DNMT1-overexpressing cells. (*P < 0.05, ** P < 0.01, ***P < 0.001)
Fig. 7
Fig. 7
Inhibition of DNMT1, CDK1, and pyrimidine metabolism reduces malignant progression of HCC. A, B Effects of the DNMT1 inhibitor (GSK3685032) on cell growth. Higher concentrations had a greater inhibitory impact on cell proliferation. C In vitro cell culture showing reduced colony formation after incubation with varying concentrations of the DNMT1 inhibitor in two cell lines. D, E Transwell assay results showing reduced migration and invasion after inhibition of DNMT1. F, G RT-PCR measurements of the relative expression of pyrimidine metabolism-related genes after inhibition of DNMT1 in two cell lines. H Treatment of MHCC97H mouse models with the DNMT1 inhibitor (GSK3685032), CDK1 inhibitor (Ro-3306), and pyrimidine metabolism inhibitor (BAY2402234). Luminescence intensities of tumors on days 7 and 35, indicating inhibitory effects on HCC. I H&E and Ki-67 staining of tumor tissues. Scale bar, 25 μm. (*P < 0.05, **P < 0.01, ***P < 0.001)

References

    1. Bray F, Laversanne M, Sung H, Ferlay J, Siegel RL, Soerjomataram I, et al. Global cancer statistics 2022: GLOBOCAN estimates of incidence and mortality worldwide for 36 cancers in 185 countries. CA Cancer J Clin. 2024;74:229–63. - PubMed
    1. Llovet JM, Kelley RK, Villanueva A, Singal AG, Pikarsky E, Roayaie S, et al. Hepatocellular carcinoma. Nat Rev Dis Primers. 2021;7: 6. - PubMed
    1. Vogel A, Meyer T, Sapisochin G, Salem R, Saborowski A. Hepatocellular carcinoma. Lancet. 2022;400:1345–62. - PubMed
    1. Zhao BS, Roundtree IA, He C. Post-transcriptional gene regulation by mRNA modifications. Nat Rev Mol Cell Biol. 2017;18:31–42. - PMC - PubMed
    1. Berggren KA, Schwartz RE, Kleiner RE, Ploss A. The impact of epitranscriptomic modifications on liver disease. Trends Endocrinol Metab. 2024;35:331–46. - PubMed

MeSH terms

LinkOut - more resources