. 2025 Aug 23;15(1):31076.
doi: 10.1038/s41598-025-16325-6.

The RASAL2 variant promotes aberrant RAS signaling and resistance to anti-EGFR therapy in colorectal cancer

Affiliations

The RASAL2 variant promotes aberrant RAS signaling and resistance to anti-EGFR therapy in colorectal cancer

Yu-Min Yeh et al. Sci Rep. .

Abstract

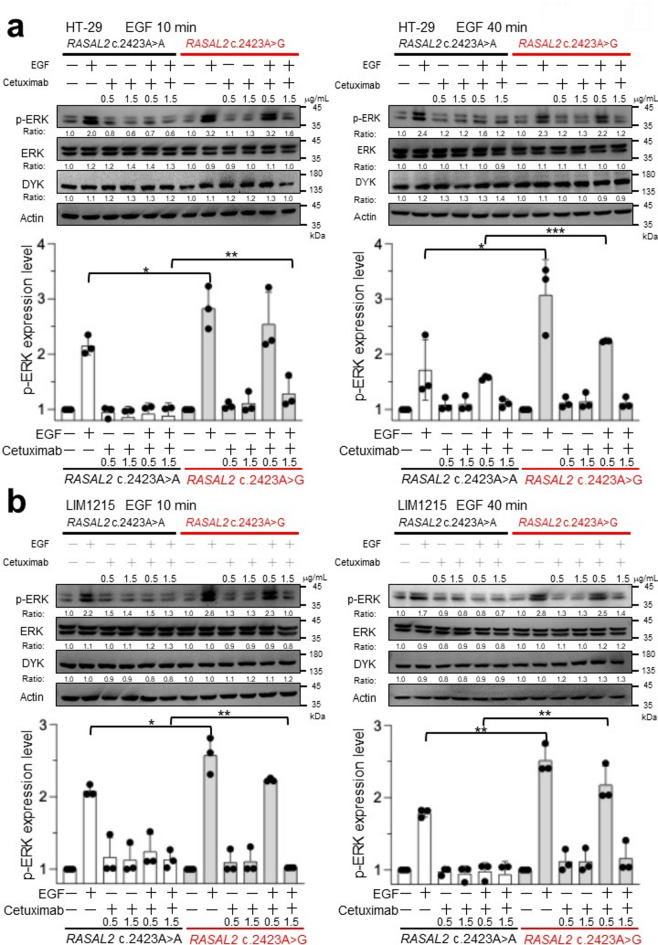
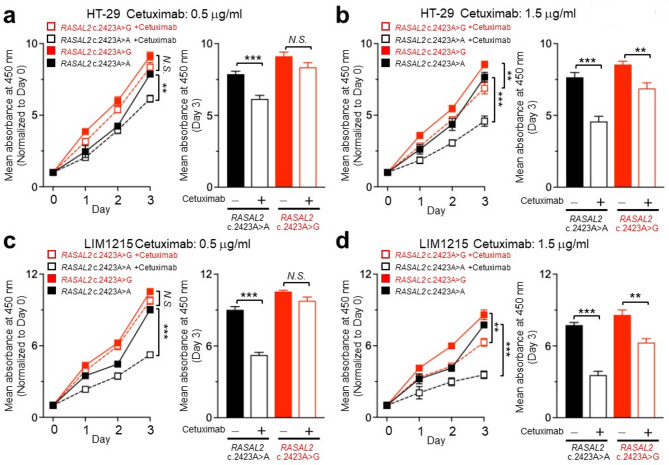
Anti-EGFR monoclonal antibodies are essential for metastatic colorectal cancer (CRC) treatment, however, resistance remains problematic in KRAS/NRAS/BRAF wild-type patients. RAS protein activator-like 2 (RASAL2) regulates RAS signaling by catalyzing the conversion of RAS. This study investigates the pathogenicity of the germline RASAL2 c.2423 A > G variant, identified in a high-risk family, and its potential role in CRC progression and therapy resistance. Population analysis reveals its rarity in East Asians (0.01%) but an increased prevalence in Taiwanese CRC patients (1.63%). Functional studies demonstrate that RASAL2 c.2423 A > G enhances RAS signaling, causing sustained ERK phosphorylation and increased CRC cell proliferation. Additionally, RASAL2-mutant cells require higher doses of cetuximab for ERK suppression and growth inhibition, indicating resistance to anti-EGFR therapy via abnormal RAS activation. According to the American College of Medical Genetics and Genomics criteria, the variant is likely pathogenic. Our study highlights RASAL2 c.2423 A > G as a potential biomarker for CRC risk and therapy response.

Keywords: RASAL2; Anti-EGFR; Colorectal cancer; Germline variant; Pathogenic; RAS signaling; Resistance.


Conflict of interest statement

Declarations. Competing interests: The authors declare no competing interests. Running title: RASAL2 variant mediates anti-EGFR resistance in colorectal cancer. Word count: 3068, 6 figures. Competing Interests: The authors declare no conflicts of interest. Figures and Figure Legends.

Figures

Fig. 1
Fig. 1
Distribution of the RASAL2 c.2423 A > G variant in normal populations and cancer patients, and its co-occurrence with KRAS mutations in CRC patients. (a) The family pedigree showing the segregation of the RASAL2 c.2423 A > G variant with cancer in a family with multiple affected members. Squares represent males, and circles represent females. Family members affected by cancer are filled in red. Deceased members are indicated by a cross. (b) The alternative allele frequency of the RASAL2 c.2423 A > G variant across different ethnic groups. The allele frequency of the variant was compared between normal Taiwanese individuals and various ethnic populations included in the 1000 Genomes Project. (c) The frequency of the RASAL2 c.2423 A > G variant in cancer patients. The clinico-genomic database from National Cheng Kung University Hospital was used to analyze the frequency of the RASAL2 c.2423 A > G variant in patients with CRC, ovarian cancer, and endometrial cancer. (d) The co-occurrence of KRAS mutations and the RASAL2 c.2423 A > G variant in CRC. KRAS mutation status was available in 196 of 367 CRC patients. No any KRAS mutation was detected in tumors from 6 patients carrying RASAL2 c.2423 A > G variant; in contrast, 76 (40%) of 190 RASAL2 wild-type patients had KRAS-mutant tumors.
Fig. 2
Fig. 2
RASAL2 c.2423 A > G variant mediates aberrant ERK phosphorylation in RAS wild-type CRC cells. (a) RASAL2 negatively regulates the RAS/RAF/MEK/ERK signaling pathway by catalyzing the conversion of RAS-GTP to RAS-GDP. It is hypothesized that the RASAL2 c.2423 A > G variant mediates abnormal activation of the RAS pathway, contributing to tumorigenesis. (b) In silico analysis of the RASAL2 c.2423 A > G variant was performed using the Functional Analysis Through Hidden Markov Models-Multiple Kernel Learning (FATHMM-MKL). (c) and (d) Representative confocal images and quantitative analysis showing the time course of ERK phosphorylation in HT29 cells with and without the RASAL2 c.2423 A >G variant in response to EGF (100 ng/mL) stimulation. Values represent the mean ± SEM from at least 30 individual cells across three independent experiments. Statistical analysis was performed using Student’s t-test. *p < 0.05, **p < 0.01, ***p < 0.001. p-ERK (green), phosphorylated ERK; DYK (red), DYKDDDDK-tag; HOE (blue), Hoechst 33,258. Scale bar: 60 μm. (e) and (f) Representative confocal images and quantitative analysis illustrating the changes in EGF-induced ERK phosphorylation in RASAL2 wild-type and mutant LIM1215 cells.
Fig. 3
Fig. 3
Western blot analysis of ERK phosphorylation in CRC cells with and without RASAL2 c.2423 A > G variant. Representative western blot images showing the expression of phosphorylated ERK (p-ERK), total ERK, and DYKDDDDK-tag (DYK) in HT29 (a) and LIM1215 (b) cells with and without the RASAL2 c.2423 A > G variant after EGF (100 ng/mL) treatment for the indicated times (upper panels). Quantification of protein expression levels is shown, representing the relative changes in the expression of each protein. Bar charts display the average relative signal intensity for the indicated time points compared to the control across three seperate experiments. Error bars represent the standard error of mean from the average of three separate experiments. The difference between each time point is tested and statistical significance is indicated as *p < 0.05; **p < 0.01; ***<0.001 (lowe panels).
Fig. 4
Fig. 4
RASAL2 c.2423 A > G enhances the proliferation ability of CRC cells. The proliferation ability of CRC cells was assessed using the MTT assay in parental, vector-only, wild-type RASAL2 (c.2423 A > A), and mutant RASAL2 (c.2423 A > G) transfected HT29 (a) and LIM1215 cells (b). Cell viability was measured over 2 days, and results are presented as the percentage increase relative to day 0 for each cell line. Bar graphs (right) provide a visual representation of cell proliferation activity on day 2. Values are expressed as the mean ± SEM from three independent experiments. Statistical analysis was performed using Student’s t-test. ***p < 0.001.
Fig. 5
Fig. 5
A higher concentration of EGFR monoclonal antibody was required to suppress EGF-induced ERK phosphorylation in RASAL2-mutant CRC cells. Representative Western blot images from three independent experiments illustrate the levels of phosphorylated ERK (p-ERK), total ERK, DYKDDDDK-tag (DYK), and actin in RASAL2 wild-type and mutant (a) HT29 and (b) LIM1215 cells treated with cetuximab. Cells were pre-treated with cetuximab at concentrations of 0.5 and 1.5 µg/mL for 72 h, followed by stimulation with EGF for 10 min (left) or 40 min (right). After EGF stimulation, cell lysates were collected and analyzed via immunoblotting using anti-p-ERK, total ERK, DYK, and actin antibodies (upper panels). The expression levels of each protein were quantified, and the relative changes are shown. Bar charts display the average relative signal intensity for each treatment compared to the control across three independent experiments. Error bars represent the standard error of mean from the average of three separate experiments. The difference between each treatment is tested and statistical significance is indicated as *p < 0.05; **p < 0.01 (lowe panels).
Fig. 6
Fig. 6
RASAL2 c.2423 A > G variant confers resistance to anti-EGFR antibody in CRC cells. (a) and (b) The proliferation ability of RASAL2 wild-type and mutant HT29 cells treated with cetuximab over a 3-day period. HT29 cells were transfected with wild-type (c.2423 A > A) and mutant RASAL2 (c.2423 A > G), and cell proliferation was assessed using the MTT viability assay after treatment with cetuximab at concentrations of 0.5 and 1.5 µg/mL (left). Cell viability was expressed as a percentage of the absorbance reading on day 0, and the results on day 3 were compared between HT29 cells with and without cetuximab treatment (right). (c) and d, The proliferation ability of RASAL2 wild-type and mutant LIM1215 cells treated with cetuximab at concentrations of 0.5 and 1.5 µg/mL over a 3-day period. Results are presented as mean ± SEM from three independent experiments. Statistical analysis was conducted using Student’s t-test. **p < 0.01, ***p < 0.001; N.S., p ≥ 0.05 (not significant).

Similar articles

References

    1. Van Cutsem, E. et al. Cetuximab and chemotherapy as initial treatment for metastatic colorectal cancer. N Engl. J. Med.360, 1408–1417 (2009). - PubMed
    1. Douillard, J. Y. et al. Randomized, phase III trial of panitumumab with infusional fluorouracil, leucovorin, and oxaliplatin (FOLFOX4) versus FOLFOX4 alone as first-line treatment in patients with previously untreated metastatic colorectal cancer: the PRIME study. J. Clin. Oncol.28, 4697–4705 (2010). - PubMed
    1. Di Fiore, F., Sesboue, R., Michel, P., Sabourin, J. C. & Frebourg, T. Molecular determinants of anti-EGFR sensitivity and resistance in metastatic colorectal cancer. Br. J. Cancer. 103, 1765–1772 (2010). - PMC - PubMed
    1. Perrone, F. et al. PI3KCA/PTEN deregulation contributes to impaired responses to cetuximab in metastatic colorectal cancer patients. Ann. Oncol.20, 84–90 (2009). - PubMed
    1. Sartore-Bianchi, A. et al. PIK3CA mutations in colorectal cancer are associated with clinical resistance to EGFR-targeted monoclonal antibodies. Cancer Res.69, 1851–1857 (2009). - PubMed

MeSH terms