. 2025 Aug 23;11(1):258.
doi: 10.1038/s41531-025-01109-6.

Brain-region-specific lipid dysregulation in L-DOPA-induced dyskinesia in a primate model of Parkinson's disease

Affiliations

Brain-region-specific lipid dysregulation in L-DOPA-induced dyskinesia in a primate model of Parkinson's disease

Ibrahim Kaya et al. NPJ Parkinsons Dis. .

Abstract

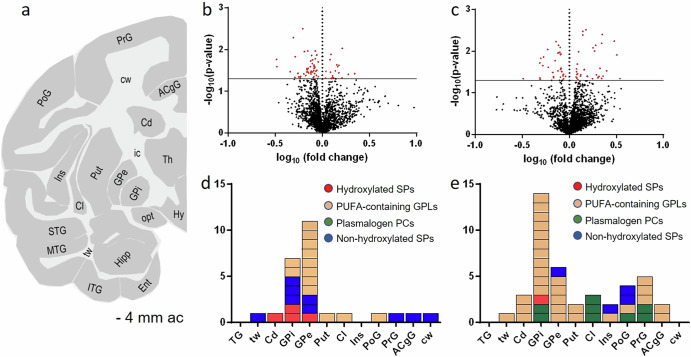
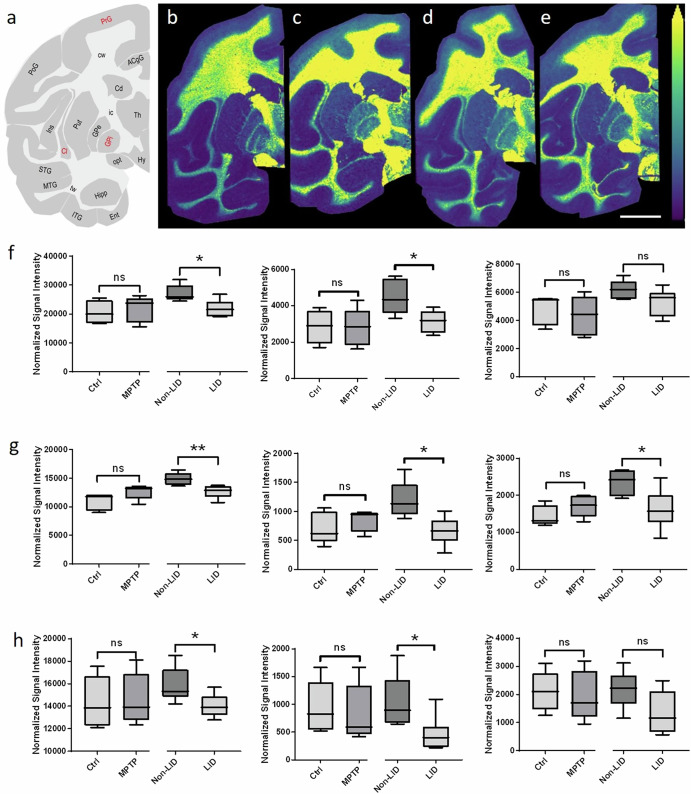
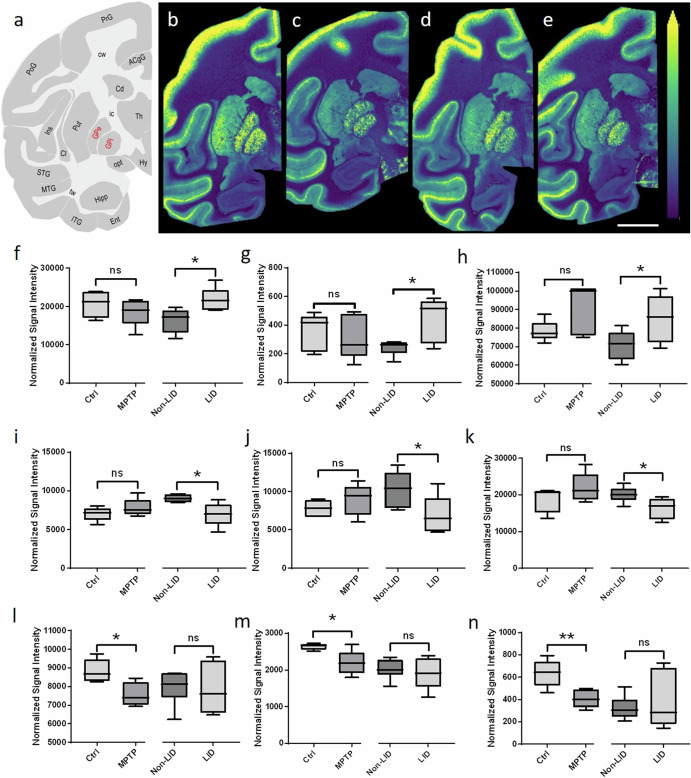
L-DOPA-induced dyskinesia (LID) is a significant and treatment-limiting complication in Parkinson's disease (PD) therapy, yet its mechanisms remain poorly understood. We used high-resolution mass spectrometry imaging to map brain-region-specific alterations of glycerophospholipids and sphingolipids in a female macaque model of PD with and without LID following chronic L-DOPA treatment. LID was associated with depletion of antioxidant plasmalogen phosphatidylcholines in the globus pallidus interna, claustrum, and precentral gyrus-regions critical for motor function-and elevations of polyunsaturated fatty acid-containing glycerophospholipids, indicative of increased membrane fluidity. This lipid profile differed from similarly treated non-dyskinetic animals, suggesting lipid composition mediates differential susceptibility to LID. Lipid alterations correlated strongly with dyskinesia severity, dopamine, and L-DOPA concentrations, supporting a mechanistic link between lipid metabolism, neurotransmitter dysregulation, and LID. This comprehensive spatial lipidomic analysis identifies region-specific lipid dysregulation as a novel aspect of LID pathology, highlighting lipid pathways as potential therapeutic targets for mitigating dyskinesia.


Conflict of interest statement

Competing interests: The authors declare no competing interests.

Figures

Fig. 1
Fig. 1. Region-specific untargeted lipidomics analysis of MALDI-FTICR-MSI data in a non-human primate model of Parkinson’s disease and L-DOPA-induced dyskinesia.
Untargeted region-specific lipidomics workflow designed to identify lipid changes displaying differences between Ctrl and MPTP in GPi and GPe brain regions and between non-LID and LID in GPi, GPe, Put, Cd, PrG, PoG, TG, Cl, tw, cw, Ins and ACgG brain regions. a Schematic of a coronal non-human primate brain tissue section at −4 mm from the ac depicting different white and grey matter brain regions. Untargeted mass lists including 4879 m/z values obtained in dual polarity mode from each analysed brain region were extracted and evaluated by hypothesis testing using multiple two-tailed t-tests. Representative volcano plots showing significantly altered m/z values in red between b Ctrl and MPTP and c non-LID and LID groups in the GPi brain region. Identified lipid molecules showing significant changes were grouped into four different classes: (i) plasmalogen phosphatidylcholines (PCs), (ii) polyunsaturated fatty acid (PUFA)-containing glycerophospholipids (GPLs), (iii) hydroxylated sphingolipids (SPs), and (iv) non-hydroxylated SPs. Lower panels: panels d and e show coloured stacked bars indicating how many lipid species from each class exhibited significant changes between d Ctrl and MPTP, and e non-LID and LID in different brain regions. PoG postcentral gyrus, PrG precentral gyrus, STG superior temporal gyrus, ACgG anterior cingulate gyrus, MTG middle temporal gyrus, ITG inferior temporal gyrus, Ent entorhinal area, Hipp hippocampus, Cd caudate nucleus, Ins insula, opt optical tract, Cl claustrum, Put putamen, GPe/GPi globus pallidus externa/interna, Hy hypothalamus, Th thalamus, ic internal capsule, tw temporal white matter, cw cerebral white matter.
Fig. 2
Fig. 2. Brain-region-specific changes in plasmalogen PCs between non-LID and LID groups.
a Schematic of a coronal non-human primate brain tissue section at -4 mm from the ac depicting different brain regions, with those showing changes in plasmalogen PCs between non-LID and LID groups labelled in red. Representative ion images of the [M + H]+ ion of PC-P (34:0) in b Ctrl, c MPTP, d non-LID, and e LID brain tissue sections at −4 mm from the ac. All ion images are scaled to the maximum intensity of the individual ion. The ion image is RMS-normalized in panels be. Lateral resolution: 150 µm; scale bar: 9 mm. Results of statistical analysis using Student’s t-test of plasmalogen PCs (from left to right) PC-P(34:0), PC-P(36:0) and PC-P(36:1) in f GPi, g Cl, and h PrG brain regions were performed using. Changes were statistically evaluated between Ctrl and MPTP, and non-LID and LID, independently. Asterisks indicate significance: *P < 0.05; **P < 0.01; ns: not significant.
Fig. 3
Fig. 3. Brain-region-specific alterations in PUFA-containing GPLs between Ctrl and MPTP, and non-LID and LID groups.
a Schematic of a coronal non-human primate brain tissue section at −4 mm from the ac depicting different brain regions, with those evaluated labelled in red. Representative images of the [M-H] ion of PI (40:6) in (from left to right) b Ctrl, c MPTP, d non-LID, and e LID brain tissue sections at −4 mm from the ac. All ion images are scaled to the maximum intensity of the individual ion. The ion images are RMS-normalized in panels be. Lateral resolution: 150 μm; scale bar: 9 mm. Results of statistical analysis using Student’s t-test of PUFA-containing GPLs f PI(40:6), g PI(40:7), h PC (36:4), i PC(38:3), j PS (38:3) and k PC(36:3) in the GPi, and l PE(40:6), m PC(40:7), and n PC(42:7) in the GPe. Changes were statistically evaluated between Ctrl and MPTP, and non-LID and LID, independently. Asterisks indicate significance: *P < 0.05; **P < 0.01; ns: not significant.
Fig. 4
Fig. 4. Correlation of LID scores, L-DOPA levels and dopamine levels with plasmalogen PCs and PUFA-containing glycerophospholipids in specific brain regions.
a Schematic of a coronal non-human primate brain tissue section at −4 mm from the ac depicting different brain regions, with those evaluated labelled in red. b Results of Pearson’s correlation analysis between plasmalogen PC levels in the GPi, GPe, Put, Cd, Cl and PrG, and LID scores of the animals or levels of L-DOPA and dopamine obtained from the same regions of consecutive tissue sections. c Schematic of a coronal non-human primate brain tissue section at −4 mm from the ac depicting different regions, with those evaluated labelled in red. d Results of Pearson’s correlation analysis between glycerophospholipid levels in the GPi and GPe, and LID scores of the animals, as well as levels of L-DOPA and dopamine obtained from the same regions in consecutive tissue sections. Heat maps are colour-coded according to Pearson’s correlation coefficients: orange and blue colours indicate positive and negative correlations, respectively. Asterisks indicate significant correlations: *P < 0.05; **P < 0.01.
Fig. 5
Fig. 5. Brain-region-specific changes in sphingolipids between Ctrl and MPTP groups.
a Schematic of a coronal non-human primate brain tissue section at −4 mm from the ac depicting different brain regions, with those evaluated labelled in red. Representative images of the [M-H] ion of SHexCer(t43:2) in (from left to right) b Ctrl, c MPTP, d non-LID, and e LID brain tissue sections at −4 mm from the ac. All ion images are scaled to the maximum intensity of the individual ion. The ion image is RMS-normalized in panels be. Lateral resolution: 150 µm; scale bar: 9 mm. Results of statistical analysis using Student’s t test of hydroxylated and non-hydroxylated sphingolipids SHexCer(t43:2) in f the GPi and g the GPe, HexCer(t42:2) in h the GPi and i the GPe, SHexCer(d40:1) in j the GPi and k the GPe, and SM (d43:2) in l the GPi and m the GPe. Changes were statistically evaluated between Ctrl and MPTP, and non-LID and LID, independently. Asterisks indicate significance: *P < 0.05; **P < 0.01; ns: not significant.
Fig. 6
Fig. 6. Brain-region-specific changes in the ratios of hydroxylated to non-hydroxylated (t/d) SHexCers between Ctrl and MPTP, and non-LID and LID groups.
a Schematic of a coronal non-human primate brain tissue section at −4 mm from the ac depicting different brain regions, with those evaluated labelled in red. Representative images of the [M-H] ion of SHexCer(t42:2) normalized to the [M-H] ion of SHexCer(d42:2) in (from left to right) b Ctrl, c MPTP, d non-LID, and e LID brain tissue sections at −4 mm from the ac. All ion distribution images are scaled to the maximum intensity of the individual ion. The ion images are RMS-normalized in panels be. Lateral resolution: 150 µm; scale bar: 9 mm. Results of statistical analysis using Student’s t-test of f SHexCer(t/d42:2), g SHexCer(t/d43.2), and h SHexCer(t/d40:1) in the GPi. Changes were evaluated between Ctrl and MPTP, and non-LID and LID. i Heat maps showing z-scores of several detected long-chain SHexCer(t/d) in the GPi, GPe, Cd and Put basal ganglia brain regions. Changes were statistically evaluated between Ctrl and MPTP, and non-LID and LID, independently. Asterisks indicate significance: *P < 0.05; **P < 0.01; ns: not significant. Asterisks in the MPTP and LID columns show results of statistical analysis between Ctrl vs. MPTP groups and LID vs. non-LID groups, respectively.

References

    1. Poewe, W. et al. Parkinson disease. Nat. Rev. Dis. Prim.3, 1–21 (2017). - PubMed
    1. Huot, P., Johnston, T. H., Koprich, J. B., Fox, S. H. & Brotchie, J. M. The pharmacology of L-DOPA-induced dyskinesia in Parkinson’s disease. Pharm. Rev.65, 171–222 (2013). - PubMed
    1. Jenner, P. Molecular mechanisms of L-DOPA-induced dyskinesia. Nat. Rev. Neurosci.9, 665–677 (2008). - PubMed
    1. Wenk, M. R. The emerging field of lipidomics. Nat. Rev. Drug Discov.4, 594–610 (2005). - PubMed
    1. Han, X. Lipidomics for studying metabolism. Nat. Rev. Endocrinol.12, 668–679 (2016). - PubMed

LinkOut - more resources