. 2025 Aug 23;16(1):7870.
doi: 10.1038/s41467-025-63039-4.

Molecular landscape, subtypes, and therapeutic vulnerabilities of central nervous system solitary fibrous tumors

Affiliations

Molecular landscape, subtypes, and therapeutic vulnerabilities of central nervous system solitary fibrous tumors

Chenhui Zhao et al. Nat Commun. .

Abstract

Solitary fibrous tumors (SFTs) of the central nervous system (CNS) are rare, aggressive mesenchymal neoplasms with high recurrence and metastasis rates. Here, we perform a comprehensive multi-omics analysis of 189 cases of CNS SFTs integrating 94 whole genome sequencing, 88 transcriptomics, 7 single-nucleus RNA sequencing and 3 spatial transcriptome sequencing. We find that receptor tyrosine kinase mutations are significantly more prevalent besides the widespread NAB2-STAT6 fusion and correlate with tumor grade. Transcriptomic analysis reveals four molecular subtypes-classical, neural-like, inflamed and migratory-each associated with distinct clinical and biological characteristics. Single-nucleus RNA sequencing identifies five tumor cell states, with the SFT_classical state serving as a precursor to other states influenced by hypoxia and inflammation. Notably, we identify FER kinase as a key therapeutic target, with FER inhibition significantly reducing tumor cell proliferation, migration and invasion. These findings provide important insights into CNS SFT biology and suggest potential therapeutic strategies for this challenging tumor type.


Conflict of interest statement

Competing interests: The authors declare no competing interests.

Figures
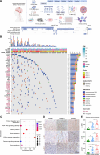
Fig. 1
Fig. 1. Landscape of high-frequency driver mutations and associated functional pathways in SFT.
A Overview of the experiment design and the number of samples for WGS, bulk RNA seq, single nucleus RNA seq, spatial transcriptome seq and primary cell culture. Created in BioRender. Wang, T. (2025) https://BioRender.com/8urwveb. B Landscape of high-frequency candidate driver mutations in SFT. C KEGG pathway enrichment analysis of genes with non-synonymous mutations identified in all WGS samples. Term Enrichment is performed by R package clusterProfiler. P-value was calculated by two-sided Kolmogorov–Smirnov test and adjusted by FDR. D, E Representative results and quantification of p-ERK, p-S6, and p-AKT immunohistochemistry (IHC) staining in different grades of SFTs. D Representative images of p-ERK, p-S6, and p-AKT IHC staining in different grades of SFTs. E Quantification of the relative intensity scores of p-ERK, p-S6, and p-AKT staining across different SFT grades. For p-ERK: Grade 1 (n = 12), Grade 2 (n = 16), Grade 3 (n = 9); for p-S6: Grade 1 (n = 13), Grade 2 (n = 15), Grade 3 (n = 9); for p-AKT: Grade 1 (n = 9), Grade 2 (n = 12), Grade 3 (n = 11). Data are presented as mean ± SEM. *p < 0.05; **p < 0.01; ***p < 0.001; ****p < 0.0001. (Student’s t-test, two-sided). Source data are provided as a Source Data file.
Fig. 2
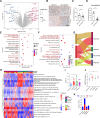
Fig. 2. Transcriptomic characterization and molecular subtypes of CNS SFTs.
A Volcano plot comparing gene expression between CNS and peripheral SFT tumors. The names of the genes marked in red are genes that are highly expressed in the nervous system. Differential analysis was performed using the R package DESeq2, and the p-value was calculated using the two-sided Wald test and corrected with FDR. BD Representative IHC staining results for Synaptotagmin and Decorin in CNS SFT (n = 6) and peripheral SFT (n = 11) (B) and their quantitative results (C, D). Data are presented as mean ± SEM. ****, p < 0.0001 (Student’s t-test, two-sided). E GO enrichment analysis of differentially expressed genes between WHO grade 3 and WHO grade 1 SFT. F GO enrichment analysis of differentially expressed genes between CNS SFT and meningioma (a merged dataset of GSE136661 and GSE189672). Term Enrichment is performed by R package clusterProfiler. P-value was calculated by two-sided Kolmogorov–Smirnov test and adjusted by FDR. G Sankey plot illustrating the relationship between WHO grade and molecular subtypes. H Heatmap showing significantly activated signaling pathways across four molecular subtypes. I–K The maximum percentage of Ki67% (I), the log10-transformed tumor volume (J) and the frequency of cystic necrosis according to radiographic result (K) in different molecular subtypes of CNS SFT. Neural-like (n = 13), Classical (n = 37), Inflamed (n = 13), Migratory (n = 17). Data are presented as mean ± SEM. *, p < 0.05; **, p < 0.01 (For (I) and (J) Student’s t-test, two-sided; for (K) Chi-square test, two-sided). Source data are provided as a Source Data file.
Fig. 3
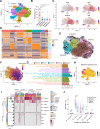
Fig. 3. Cellular states of CNS SFTs by snRNA-seq.
A Uniform Manifold Approximation and Projection (UMAP) diagram of the different SFT states and cell types of the tumor microenvironment identified by snRNA-seq. SFT_Classical, SFT_Inflamed, SFT_Neural, SFT_Migratory, SFT_Angiogenic: SFT cells with different cellular states; Endo: Endothelial cell; Peri: Pericyte; Macro: Macrophage; Fibro: Fibroblast. B Proportion of different SFT cellular states in seven samples subjected to snRNA-seq sequencing (n = 7). Data are presented as mean ± SEM. *, p < 0.05; **, p < 0.01. (Student’s t-test, two-sided). C Projection of CD34, CD44, ALDH1A1 and ENG expression on the UMAP plot of the major cell types identified in SFT snRNA-seq. D Heatmap of SCENIC binary regulon activities in different SFT states. E RNA velocity plot embedded in UMAP space showing the putative near-transcriptional state of the different CNS SFT cellular states. F Pseudotime trajectory analysis of CNS SFT cell states. G Gene set variation analysis (GSVA) of gene sets or pathways enriched in different SFT cellular states. H Projection of the average expression of 200 genes from the HALLMARK_HYPOXIA gene set onto the UMAP plot of SFT snRNA-seq. I Proportion of different cell types deconvoluted from the bulk transcriptomic data (n = 88). Only cell types with a proportion >5% in the sample are shown. J Proportion of SFT-specific cell types in the four molecular subtypes (total sample n = 88). *p < 0.05; **p < 0.01; ***p < 0.001. (two-sided Wilcoxon Rank Sum and Signed Rank tests). Boxplots display the median (center line), interquartile range (box), and whiskers extending to the smallest and largest values within 1.5 × IQR from the lower (Q1) and upper (Q3) quartiles, respectively. Source data are provided as a Source Data file.
Fig. 4
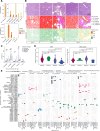
Fig. 4. Spatial heterogeneity and cell-cell interactions in the CNS SFTs.
A Proportion of distinct cell types in three spatial samples, categorized by WHO grade 1-3. B Hematoxylin and eosin (H/E) staining of representative regions of different SFT grades and the spatial distribution of SFT cellular states in the corresponding regions as well as the average expression levels of genes from the HALLMARK_HYPOXIA gene set. A total of six samples were included: one grade I, two grade II, and one grade III. Staining was performed in three independent replicates. C Proportion of cell types from the tumor microenvironment in the four molecular subtypes (total sample n = 88). *p < 0.05; **p < 0.01; ***p < 0.001. (two-sided Wilcoxon Rank Sum and Signed Rank tests). Boxplots display the median (center line), interquartile range (box), and whiskers extending to the smallest and largest values within 1.5 × IQR from the lower (Q1) and upper (Q3) quartiles, respectively. D The immune infiltration in different molecular subtypes by EPIC (left) and MCP-counter (right). Two-sided Wilcox test was used to calculate the differences among four subtypes. E Cell-cell communication between different cell types in CNS SFTs deduced from snRNA-seq. Source data are provided as a Source Data file.
Fig. 5
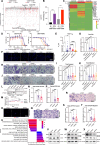
Fig. 5. Identification of FER kinase as a therapeutic target in SFT.
A Viability of primary SFT cells (CBSFT6940 and CBSFT6596) treated with FDA-approved and experimental compounds. B Proportion of compounds with >90% inhibition among all screened vs. tyrosine kinase inhibitors (two-sided Chi-square test). C Heatmap of the inhibitory effect of ceritinib, pyrotinib and tucatinib on 76 tyrosine kinases at a concentration of 1 μM. D Dose–response curves of primary SFT cells treated with ceritinib, pyrotinib, tucatinib, E260, and DS21360717 (biological replicates n = 3). E IC50 of ceritinib, pyrotinib, tucatinib, E260, and DS21360717 on primary SFT cells (n = 13, except for Tucatinib n = 6). F Representative EdU staining image of primary SFT cell CBSFT3965 treated with DMSO, tucatinib, pyrotinib, ceritinib, E26,0 and DS21360717. G Quantification results of EdU positive cell ratio from primary SFT cells showing reduced proliferation upon treatment (n = 4). HK Representative Crystal Violet staining images and quantifications for invasion (H, I) and migration (J, K) assays in primary SFT cells treated with DMSO, tucatinib, pyrotinib, ceritinib, E260, and DS21360717 (n = 5). L Western blot showing FER knockdown in CBSFT1248 and CBSFT6596 (4 cells were validated). M Growth curve of FER-silenced CBSFT1248 vs. control (biological replicates n = 3). N Normalized growth of shControl, shFER1 and shFER2 in primary SFT cells (n = 9). O, P Representative EdU staining and quantification in SFT cells expressing control or FER shRNAs (n = 9). QT Representative Crystal Violet staining images and quantifications for invasion (Q, S) and migration (R, T) assays in SFT cells expressing control or FER shRNAs (n = 9). U Gene Set Enrichment Analysis showing pathways affected by FER silencing. VX Western blots of phosphorylated ERK (V), AKT (W) and FAK (X) upon FER silencing (4 cells were validated). Data are presented as mean ± SD. *p < 0.05; **p < 0.01; ***p < 0.001; ****p < 0.0001. Tests: two-sided Student’s t-test, Chi-square test, one-way or two-way ANOVA. Source data are provided as a Source Data file.

References

    1. Robinson, D. R. et al. Identification of recurrent NAB2-STAT6 gene fusions in solitary fibrous tumor by integrative sequencing. Nat. Genet.45, 180–185 (2013). - PMC - PubMed
    1. Chmielecki, J. et al. Whole-exome sequencing identifies a recurrent NAB2-STAT6 fusion in solitary fibrous tumors. Nat. Genet.45, 131–132 (2013). - PMC - PubMed
    1. Carneiro, S. S., Scheithauer, B. W., Nascimento, A. G., Hirose, T. & Davis, D. H. Solitary fibrous tumor of the meninges: a lesion distinct from fibrous meningioma: a clinicopathologic and immunohistochemical study. Am. J. Clin. Pathol.106, 217–224 (1996). - PubMed
    1. Piscopo, A. J. et al. Surgical management of craniospinal axis solitary fibrous tumors: a single-institution case series and comprehensive review of the literature. Neurosurgery94, 358–368 (2024). - PMC - PubMed
    1. Sughrue, M. E. et al. The relevance of simpson grade I and II resection in modern neurosurgical treatment of World Health Organization grade I meningiomas: clinical article. J. Neurosurg.113, 1029–1035 (2010). - PubMed

MeSH terms

LinkOut - more resources