. 2025 Aug 23;44(1):252.
doi: 10.1186/s13046-025-03512-6.

H4K79 and H4K91 histone lactylation, newly identified lactylation sites enriched in breast cancer

Affiliations

H4K79 and H4K91 histone lactylation, newly identified lactylation sites enriched in breast cancer

Jiena Liu et al. J Exp Clin Cancer Res. .

Abstract

Metabolic reprogramming and epigenetic modification are two hallmarks of cancer. Protein lysine lactylation (Kla) is a novel type of glycolysis lactate-triggered posttranslational modification. However, the role of Kla in breast cancer (BC) remains largely unknown. Here, western blot, and immunohistochemical (IHC) staining of BC tissues revealed that global Kla levels were upregulated in BC tissues, and high levels of Kla were correlated with poor prognosis of patients with BC. A series of in vitro and in vivo assays demonstrated that interruption of glycolysis by lactate dehydrogenase (LDH) inhibitor or silencing LDHA and LDHB repressed the malignant behaviors of BC cells. Moreover, 4D label-free quantitative lactylproteomics analysis of BC tissues and cells revealed that lactylated proteins widely existed in several subcellular compartments and were closely associated with various cancer-related biological processes. Notably, two previously unresearched sites of histone lactylation, H4K79 lactylation (H4K79la) and H4K91 lactylation (H4K91la), were identified to be hyperlactylated in cancer tissues and cells. Glycolytic genes, such as lactate dehydrogenase A (LDHA), phosphoglycerate kinase 1 (PGK1), and hexokinase 1 (HK1) were identified to be the potential candidate genes epigenetically regulated by H4K79la and H4K91la by intersecting through chromatin immunoprecipitation sequencing (ChIP-seq), RNA sequencing (RNA-seq), and TCGA-BRCA database. Pharmacological inhibition of glycolysis downregulated H4K79 and H4K91 lactylation and suppressed the expression of glycolytic genes, whereas treatment with sodium lactate exhibited the opposite effects. Additionally, E1A-binding protein p300 (P300) acted as lysine lactyltransferase to regulate H4K79la and H4K91la, and control the transcription and expression of downstream glycolytic genes in BC cells. The results revealed an intriguing positive feedback loop formed by glycolysis/H4K79la/H4K91la/glycolytic genes in BC, highlighting the relationship between metabolic reprogramming and epigenetic regulation. These findings provide new therapeutic targets for patients with BC.

Keywords: Breast cancer; Epigenetic modification; Glycolysis; Lactylation; Post-translational modifications.


Conflict of interest statement

Declarations. Ethics approval: The Medical Ethics Committee of Harbin Medical University Cancer Hospital approved this study (KY2023-84). Consent for publication: Not applicable. Competing interests: The authors declare no competing interests.

Figures

Fig. 1
Fig. 1
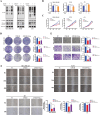
Kla levels were significantly upregulated in BC patients and were correlated with poor prognosis. (A). Pan-Kla levels in BC tissues and paired normal adjacent tissues were measured by western blot. (B). Representative IHC images of BC tissues and normal tissues. (C). Statistical results of lactyation levels in normal and BC tissues. Scale bars: 100 μm (10x); 50 μm (20x). (D). Kaplan-Meier analysis and log-rank tests of overall survival in BC patients with low (n = 101) and high pan-Kla (n = 133) levels. (E). Representative pictures of IHC staining of lactylation levels in different TNM stage of BC tissues. Scale bars: 100 μm (10x); 50 μm (20x). (F). Statistical results of lactyation levels in different TNM stage of BC tissues. (G). Measurement of intracellular lactate levels in BC cells (T-47D, MCF7, UACC-812, MDA-MB-468, MDA-MB-231, MDA-MB-453, hs578T, and BT-549) and human normal mammary epithelial cell line MCF 10 A. (H) The lactylation levels in BC cells (T-47D, MCF7, UACC-812, MDA-MB-468, MDA-MB-231, MDA-MB-453, Hs578T, and BT-549) and human normal mammary epithelial cell line MCF 10 A were detected by western blot. Error bars represent the mean ± SD. *P < 0.05, ** P < 0.01, *** P < 0.001, **** P < 0.0001
Fig. 2
Fig. 2
Global lactylation levels in BC cells were regulated by lactate content. (A). Schematic representation of experimental design to regulate glycolysis and Kla level. (B). Western blot analysis of Pan Kla level in BC cells (MDA-MB-468, MCF7, T-47D, and 4T1) cultured in different concentrations of NaLac for 24 h. (C). Measurement of lactate levels in BC cells (MDA-MB-468, MCF7, T-47D, and 4T1) cultured in different concentrations of NaLac for 24 h. (D-E). BC cells were transfected with siLDHA, siLDHB or both siLDHA and siLDHB, then incubated with or without NaLac for 24 h. (D). LDHA, LDHB, and Pan Kla levels in MDA-MB-468 and T-47D cells subjected to various treatment groups were analyzed by Western blot. (E). Relative mRNA levels of LDHA and LDHB in MDA-MB-468 and T-47D cells subjected to various treatment groups were analyzed by qRT-PCR analysis. * P < 0.05, ** P < 0.01, *** P < 0.001, **** P < 0.0001
Fig. 3
Fig. 3
The inhibitory effect on the malignant behavior of BC cells after Simultaneous silencing LDHA and LDHB could be partially restored by adding exogenous NaLac. (A-D). BC cells were transfected with siLDHA, siLDHB or both siLDHA and siLDHB, then incubated with or without NaLac for 24 h. (A). Proliferation ability of MDA-MB-468 and T-47D cells subjected to various treatment groups were analyzed by CCK8 assay. (B). Migration ability of MDA-MB-468 and T-47D cells subjected to various treatment groups were analyzed by wounding healing assay. The wound space was photographed at 0, 24 and 48 h. Scale bars: 200 μm. (C). Invasion ability of MDA-MB-468 and T-47D cells subjected to various treatment groups were analyzed by transwell assay. Scale bars: 200 μm. (D). Proliferation capacity of MDA-MB-468 and T-47D cells subjected to various treatment groups were analyzed by colony formation assays. Relative cell numbers are shown as means ± SD.* P < 0.05, ** P < 0.01, *** P < 0.001, **** P < 0.0001
Fig. 4
Fig. 4
Glycolysis inhibitor reduced global Kla levels and inhibited the malignant behavior of BC cells both in vitro and in vivo. (A). Measurement of the lactate content and Pan Kla level in MDA-MB-468, T-47D, and 4T1 cells cultured in different concentrations of GNE140 for 24 h by Western blot and Lactate Colorimetric Assay Kit. (B). Cell proliferation ability was evaluated by CCK8 assays in 4T1 cell after treatment with different concentrations of GNE140. (C). Cell migration ability was evaluated by wounding healing assay in 4T1 cell after treatment with different concentrations of GNE140. The wound space was photographed at 0 and 24 h. Scale bars: 200 μm. (D). Cell invasion ability was evaluated by transwell assays in 4T1 cell after treatment with different concentrations of GNE140. Scale bars: 200 μm. (E). Cell proliferation ability was evaluated by colony formation assays in 4T1 cell after treatment with different concentrations of GNE140. (F). General pictures of tumor tissues demonstrated the suppressive effect of GNE140 in 4T1-bearing mice model (n = 6). Tumor growth curves (G) and tumor weight (H) were shown in control and different concentrations of GNE40 treatment groups (2.5 mg/kg, 5.0 g/kg). (I). Representative IHC images with Pan-Kla of mouse tissues in each treatment groups. Scale bars: 100 μm (10x); 50 μm (20x). Error bars represent the mean ± SD. * P < 0.05, ** P < 0.01, *** P < 0.001, **** P < 0.0001
Fig. 5
Fig. 5
The inhibitory effect on global Kla levels and the malignant behavior of BC cells after GNE140 treatment could be partially restored by adding exogenous NaLac. (A-F) BC cells were treated with GNE140 then incubated with or without NaLac for 24 h. (A, B) Pan Kla and Lactate levels in different group of MDA-MB-468, T-47D and 4T1 cells were measured by Western blot and Lactate Colorimetric Assay Kit. (C-F). Proliferation, invasion and migration capabilities of BC cells in different treatment groups were analyzed by CCK8 assay (C), colony formation assay (D), transwell assay (E), and wounding healing assays (F), respectively. Error bars represent the mean ± SD. * P < 0.05, ** P < 0.01, *** P < 0.001, **** P < 0.0001. Scale bars: 200 μm
Fig. 6
Fig. 6
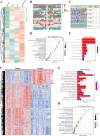
Characterization of the lactylome in BC tissues and cells. (A). A heatmap displaying various up-regulated and down-regulated protein lactylation sites in BC cells (MCF7, T-47D, and MDA-MB-468) as compared to normal epithelial cell (MCF10A). Each row represents one lactylation modification site, and each column represents a different type of breast cell lines (MCF 10 A, MCF7, T-47D, and MDA-MB-468). Red represents high expression, green indicates low expression, and gray denotes non-quantifiable values in the corresponding sample. (B). Heatmap of the 21 amino-acid compositions of the Kla site showing the frequency of the different amino acids in the specific upstream (orange) 10 amino acids or downstream (green) 10 amino acids positions of the lactylated lysine. Different colors represent the preference of each residue in the position of a 21 amino-acid-long sequence context (red indicates greater possibility, whereas green refers to less possibility). (C) The ten amino acids up- and downstream of the Kla using Motif-X are analyzed and the top five motifs with the highest scores are shown. The height of each letter corresponds to the frequency of that amino-acid residue in that position. The central K refers to the lactylated lysine. (D). GO-BP enrichment analysis of common DELPs identified in BC cells (MCF7, T-47D, and MDA-MB-468). (E). KEGG pathway enrichment analysis of common DELPs identified in BC cells. (F-H). lactylproteomics analysis of 113 tumor tissues and 88 NAT samples. (F). Heatmap of differentially expressed lactylation sites between BC tissues (grey) and normal tissues (pink bar). Each row represents one lactylation modification site, and each column represents a different tissue sample. Red represents high expression, blue indicates low expression, and gray denotes non-quantifiable values in the corresponding sample. (G). KEGG pathway enrichment analysis of DELPs identified in BC tissues. (H). GO-BP enrichment analysis of DELPs identified in BC tissues
Fig. 7
Fig. 7
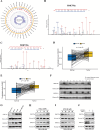
BC exhibited elevated levels of H4K79la and H4K91la and regulated by glycolysis and lactate levels. (A). Quantitative comparative analysis of the abundance of Kla sites on histone was shown by radar map, the inner circle represents the mean log2-normalized quantitative values of the Kla levels at specific sites in tumor (gray) and normal (purple) tissues, the numbers represent the FC values of tumor tissue/normal tissue, larger FC values correspond to larger dots diameters, and outside circle represents differentially expressed histone lactylation modification sites identified in BC tissues. (B). Mass spectrometry extracted from lactylproteomics data verified the lactylation modification at H4K79. (C). Mass spectrometry extracted from lactylproteomics data verified the lactylation modification at H4K91. (D, E). Paired analysis of the H4K79la (D) and H4K91la (E) levels in tumor tissues and their paired normal adjacent tissues. (F). Western blot analysis of H4K79la and H4K91la levels in BC tissues and paired normal adjacent tissues. (G). Western blot analysis of H4K79la and H4K91la levels in BC cells and normal mammary epithelial cell (MCF 10 A). (H-I). Western blot analysis of H4K79la and H4K91la levels in MDA-MB-468 cell cultured in different concentrations of NaLac (H) or treated with different doses of GNE140 (I). (J) Western blot analysis of H4K79la and H4K91la levels in MDA-MB-468 cell treated with GNE140 then incubated with or without NaLac
Fig. 8
Fig. 8
ChIP-seq analysis of H4K79la and H4K91la, and RNA-seq analysis of cells treated with NaLac or LDH inhibitor. (A). The heatmaps for H4K79la and H4K91la binding peaks in the transcription start site. Color depth indicates the relative number of reads. (B). GO analysis of H4K79la-realted promoter peak genes. (C). KEGG analysis of H4K79la-realted promoter peak genes. (D). Heatmap of differentially expressed genes in GNE140-treated group based on RNA-seq. (E). GSEA analyses of Glycolysis/Gluconeogenesis pathway based on the RNA-seq data from GNE140-treated group versus control group. (F). KEGG analysis of differentially expressed genes after GNE140 treatment. (G). Heatmap of differentially expressed genes in NaLac-treated group based on RNA-seq. (H). GSEA analyses of Glycolysis/Gluconeogenesis pathway based on the RNA-seq data from NaLac-treated group versus control group. (I). KEGG analysis of differentially expressed genes after NaLac treatment
Fig. 9
Fig. 9
Identification of the potential target genes of H4K79la. (A). Combination of ChIP-seq, RNA-seq and TCGA-BRCA database to identify the potential downstream targets of H4K79la. (B). A scatterHist showing the correlation among the expression of LDHA, PGK1 and HK1 based on the TCGA-BRCA cohort. Significance was determined by Pearson correlation analysis. (C). Differential expression of LDHA, PGK1 and HK1 in TCGA-BRCA cohort. (D). Representative IGV tracks showing enriched H4K79la modification in PGK1, LDHA, and HK1 promotor regions by ChIP-seq. Arrows are the H4K79la peaks at the gene promotor. (E). Representative IGV tracks showing decreased PGK1, LDHA, and HK1 expression upon LDH inhibitor treatment by RNA-seq
Fig. 10
Fig. 10
H4K79la regulated the transcription of LDHA, PGK1, and HK1. (A). RT-qPCR validation the mRNA expression of LDHA, HK1, and PGK1 in cancerous tissues and the normal adjacent tissues (n = 10). (B). Expression of HK1, LDHA, and PGK1 were detected in cancerous tissues and the normal adjacent tissues by Western blot (n = 10). (C). ChIP-qPCR assay of H4K79la status in the PGK1 promoter region in MDA-MB-468 and T-47D cells upon treatment with GNE140, NaLac, or GNE140 combined NaLac. (D). ChIP-qPCR assay of H4K79la status in the LDHA promoter region in MDA-MB-468 and T-47D cells upon treatment with GNE140, NaLac, or GNE140 combined NaLac. (E). ChIP-qPCR assay of H4K79la status in the HK1 promoter region in MDA-MB-468 and T-47D cells upon treatment with GNE140, NaLac, or GNE140 combined NaLac. (F). Expression levels of the LDHA, PGK1 and HK1 in MDA-MB-468, T-47D, and 4T1 cells treated with different concentrations of GNE140 for 24 h by RT-qPCR and Western blot. (G). Expression levels of the LDHA, PGK1 and HK1 in MDA-MB-468, T-47D, and 4T1 cells treated with different concentrations of NaLac for 24 h by RT-qPCR and Western blot. (H). Expression levels of the LDHA, PGK1 and HK1 in MDA-MB-468, T-47D, and 4T1 cells treated with GNE140, NaLac, or GNE140 combined NaLac by RT-qPCR and Western blot. Error bars represent the mean ± SD. * P < 0.05, ** P < 0.01, *** P < 0.001, **** P < 0.0001
Fig. 11
Fig. 11
P300 is the potential writer of H4K79la and H4K91la in BC cells. (A). Correlation analysis of P300 expression and LDHA, PGK1 or HK1 expression in the TCGA-BRCA cohort. Significance was determined by Pearson correlation analysis. (B-C). Expression levels of the P300, LDHA, PGK1 and HK1 in MDA-MB-468 (B) and T-47D (C) cells after treated with siRNA for P300 by RT-qPCR. (D). Western blot analysis of P300, pan-Kla, LDHA, PGK1, HK1, H4K79la and H4K91la levels in MDA-MB-468 and T-47D cells after treated with siRNA for P300. (E-G). ChIP-qPCR assay of H4K79la status in the LDHA (E), PGK1 (F), and HK1 (G) promoter region in MDA-MB-468 and T-47D cells after treated with siRNA for P300. (H). ChIP-qPCR assay of H4K91la status in the HK1 promoter region in MDA-MB-468 and T-47D cells after treated with siRNA for P300. All data are presented as mean ± SD. * P < 0.05, ** P < 0.01, *** P < 0.001, **** P < 0.0001

References

    1. Sun L, Zhang H, Gao P. Metabolic reprogramming and epigenetic modifications on the path to cancer. Protein Cell. 2022;13(12):877–919. - PMC - PubMed
    1. Hanahan D, Weinberg RA. Hallmarks of cancer: the next generation. Cell. 2011;144(5):646–74. - PubMed
    1. Ge T, Gu X, Jia R, et al. Crosstalk between metabolic reprogramming and epigenetics in cancer: updates on mechanisms and therapeutic opportunities. Cancer Commun (Lond). 2022;42(11):1049–82. - PMC - PubMed
    1. Luo M. Chemical and biochemical perspectives of protein lysine methylation. Chem Rev. 2018;118(14):6656–705. - PMC - PubMed
    1. Dancy BM, Cole PA. Protein lysine acetylation by p300/CBP. Chem Rev. 2015;115(6):2419–52. - PMC - PubMed

LinkOut - more resources