. 2025 Aug 23;13(1):109.
doi: 10.1186/s40364-025-00822-x.

Targeting RPS6KC1 to overcome enzalutamide resistance in prostate cancer

Affiliations

Targeting RPS6KC1 to overcome enzalutamide resistance in prostate cancer

Fu-Hao Ji et al. Biomark Res. .

Abstract

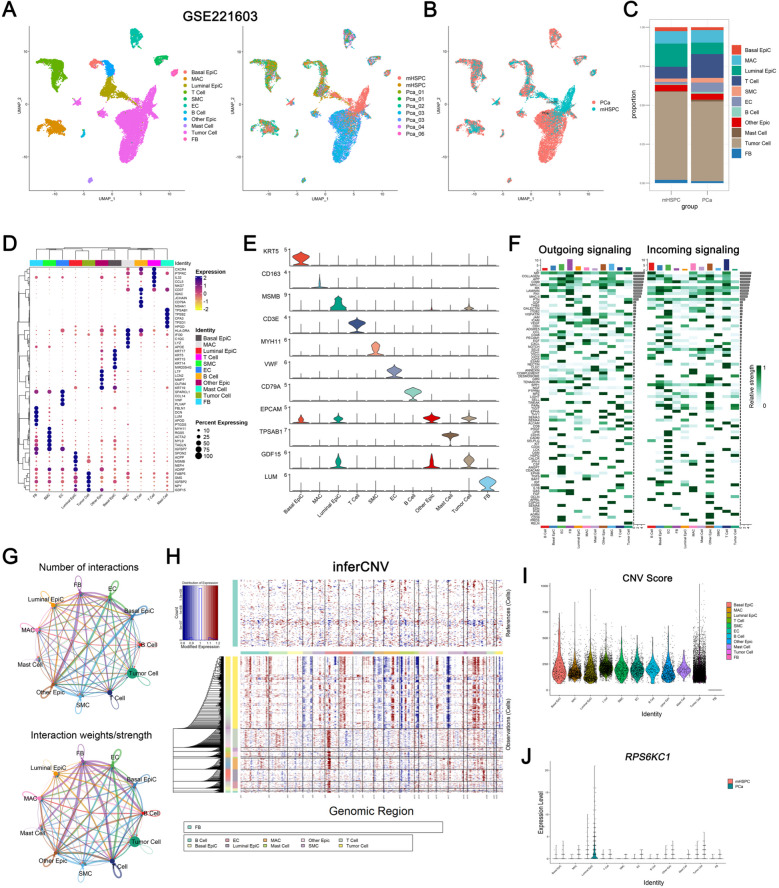
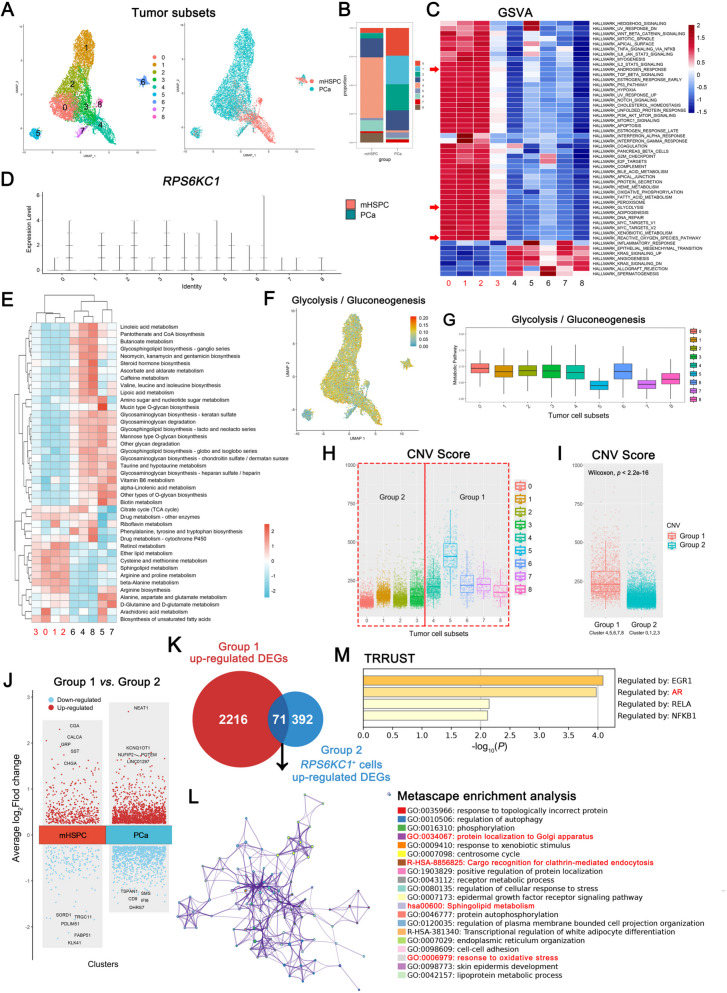
The androgen receptor signaling inhibitor enzalutamide (Enz) is one the primary therapeutic drugs for advanced prostate cancer (PCa). Nevertheless, most of patients ultimately develop resistance to Enz. Through an integrated analysis of CRISPR genome-wide and kinome-wide screens, coupled with observations of elevated expression levels in Enz-resistant cell lines and PCa tumor tissues, our study identified RPS6KC1 as a novel essential gene implicated in Enz resistance. Mechanistically, our research indicates that the Warburg effect induces H3K18 lactylation, which regulates the expression of RPS6KC1 via the transcription factor P65. Elevated expression of RPS6KC1 was found to recruit PRDX3 to the mitochondria, thereby mitigating ferroptosis. These findings suggest that the H3K18la/NF-κB/RPS6KC1/PRDX3 axis is important for the development of resistance to Enz. Our results suggest that the combination of Enz with targeted RPS6KC1 inhibition or a ferroptosis inducer may represent a promising therapeutic strategy to overcome Enz resistance.

Keywords: Enzalutamide; Prostate cancer; RPS6KC1; scRNA-seq.


Conflict of interest statement

Declarations. Ethics approval and consent to participate: All procedures conducted in this research adhered to the ethical standards set forth by the Ethics Committee of Shanghai Sixth People's Hospital, as well as the 1964 Helsinki Declaration and its subsequent amendments or comparable ethical guidelines. Consent for publication: Not application. Competing interests: The authors declare no competing interests.

Figures

Fig. 1
Fig. 1
Integrated CRISPR screen identify RPS6KC1 as a novel essential gene in Enz resistance. A The Venn diagram illustrates the integrated analysis of CRISPR genome-wide and kinome-wide screens. The results from the CRISPR kinome-wide screen, which includes 763 human kinases from dataset GSE203362, were analyzed by identifying overlaps with the top 1% of genes ranked in the CRISPR genome-wide screen. Eight genes were found to overlap between the two CRISPR datasets. B These overlapping genes were plotted to validate our findings, tracing back to the source dataset GSE203362, with the candidate gene being highlighted. C The expression levels of the overlapping genes were examined within the TCGA-PRAD dataset. D The expression of RPS6KC1 was analyzed across multiple tumor types in the TCGA database. E The transcriptional levels of RPS6KC1 across various Gleason scores in the TCGA-PRAD dataset. FH The relative gene expression of RPS6KC1 is compared between control and EnzR groups in the GSE104935 dataset (F), between DMSO and Darolutamide (Daro) treatments in the GSE148397 dataset (G), and among BPH, primary tumor, and CRPC in the GSE70770 dataset (H). I A Kaplan–Meier plot illustrating the impact of RPS6KC1 expression levels and Gleason scores on the survival of patients with PRAD. J IHC images of RPS6KC1 in PCa and normal prostate tissues sourced from the HPA database. Statistical analyses included a two-tailed Student's t-test (F, G, and H), and a log-rank test (I). Error bars represent ± SD
Fig. 2
Fig. 2
PCa tissue characteristics analysis by scRNA-seq. A UMAP visualization reveals cells divided into eleven distinct clusters, each identified by a unique color corresponding to its phenotype. B A graph represents the distribution of these eleven cell clusters across two sample groups. C A graph illustrates the distribution of cell proportions across different samples, with the vertical axis representing the proportion of each cell type. D A heatmap displays the top five DEGs within each cell cluster. E Stacked violin plots highlight the most significant variable genes within each cluster. F The heatmap illustrates the CellChat signaling dynamics across each cluster. The left panel depicts the outgoing signaling patterns, represented by the expression weight values of signaling molecules, while the right panel illustrates the incoming signaling patterns, indicated by the expression weight values of signaling receptors. The gradient from white to dark green signifies a range from low to high expression weight values within the heatmap. G The diagram presents the number of interactions among eleven distinct cell clusters. The line width corresponds to the number of interaction pairs, and varying colors denote different signaling sources. H Chromosomal landscape of inferred CNVs among eleven distinct types. I Feature plots illustrate the inferred CNV scores across eleven distinct types. J Violin plots showing the expression level of RPS6KC1 gene among the eleven cell clusters across two sample groups
Fig. 3
Fig. 3
Highly malignant tumor cells identification. A The UMAP plot illustrates the PCA clustering outcomes of tumor cell subclusters and sample clustering. B A graph depicts the distribution of tumor cell proportions across distinct samples, with the vertical axis representing the proportion of each cell type. C A heatmap presents pathways enriched in the nine tumor cell clusters using GSVA, with columns representing cell groups and rows indicating pathways. D Violin plots display the expression levels of the RPS6KC1 gene across the nine tumor cell clusters. E The heatmap provides a comparison of multiple metabolism pathway scores among the nine tumor cell clusters. F The UMAP visualization depicts the scores of the Glycolysis/Gluconeogenesis pathway. G The scores of the Glycolysis/Gluconeogenesis pathway are compared across nine distinct tumor cell clusters. H Feature plots display the inferred CNV scores within the nine tumor cell clusters. I A comparative analysis of infer CNV scores is conducted between CNV Group1 and Group2. J A volcano plot illustrates the differential gene expression between Group1 and Group2 tumor cells in mHSPC and PCa samples. K A Venn diagram visualizes the overlap of 71 common hub genes shared between the up-regulated DEGs in Group1 and the up-regulated DEGs in RPS6KC1+ cells of in Group2. L The functional enrichment analysis of 71 common hub genes. M The TRRUST enrichment analysis from 71 common hub genes. The horizontal axis represented the p-value of GO terms on Metascape
Fig. 4
Fig. 4
RPS6KC1-related transcriptional patterns identification. A Utilizing the optimal soft threshold, a co-expression network was constructed, and genes were organized into distinct modules. The upper section depicted the hierarchical clustering dendrogram, whereas the lower section illustrated the gene modules or network modules. B The Plot Module Trait Correlation function within the hdWGCNA package produced a heatmap illustrating the correlation between gene modules and tumor cell clusters. Tumor cell clusters 0, 1, 2, and 3 were consolidated and analyzed as the AR response module-trait. C Co-expression network analysis was conducted to compute feature gene-based connectivity, thereby identifying the correlation between cell clusters and the gene module-trait. D The first 25 eigengenes core genes of each module and comprehensively compared the connections. E MCODE analysis showed the hub gene correlation of each module. F The functional enrichment analysis of yellow module hub genes. G Enriched DisGeNET terms of yellow module genes. The horizontal axis represented the p-value of GO terms on Metascape. H The TRRUST enrichment analysis from the yellow module genes. The horizontal axis represented the p-value of GO terms on Metascape
Fig. 5
Fig. 5
RPS6KC1 alters Enz resistance via H3K18la/P65/RPS6KC1/PRDX3 signaling. A The relative levels of RPS6KC protein and key ferroptosis markers in LNCaP WT and EnzR cells, subjected to treatment with or without 10 μM Enz for 72 h, were analyzed using Western blotting. B Western blotting was employed to detect Pan-Kla levels in LNCaP cells, with or without Enz burden. C Site-specific histone lactylation in LNCaP WT and EnzR cells was analyzed through Western blotting. D Western blot analysis was conducted to assess key markers of ferroptosis in LNCaP EnzR cells, both with and without RPS6KC1 ablation under Enz burden conditions. E Representative immunofluorescence images demonstrate the co-localization of Mitotracker and PRDX3 in LNCaP cells. Scale bars represent 20 μm. F Assessment of mitochondrial and cytosolic levels of PRS6KC1 and PRDX3 was performed in LNCaP cells under conditions with or without Enz burden. G The schematic diagram illustrates the mechanism through which PRS6KC1 mitigates ferroptosis and enhances Enz resistance by recruiting PRDX3

References

    1. Siegel RL, Giaquinto AN, Jemal A. Cancer statistics, 2024. CA Cancer J Clin. 2024;74:12–49. - PubMed
    1. Desai K, McManus JM, Sharifi N. Hormonal therapy for prostate cancer. Endocr Rev. 2021;42:354–73. - PMC - PubMed
    1. Teo MY, Rathkopf DE, Kantoff P. Treatment of advanced prostate cancer. Annu Rev Med. 2019;70:479–99. - PMC - PubMed
    1. Freedland SJ, et al. Improved outcomes with enzalutamide in biochemically recurrent prostate cancer. N Engl J Med. 2023;389:1453–65. - PubMed
    1. Shafi AA, Yen AE, Weigel NL. Androgen receptors in hormone-dependent and castration-resistant prostate cancer. Pharmacol Ther. 2013;140:223–38. - PubMed

LinkOut - more resources