. 2025 Aug 23;23(1):378.
doi: 10.1186/s12964-025-02378-7.

Elevated levels of Letm1 drives mitochondrial dysfunction and cardiomyocyte stress-mediated apoptosis in cultured cardiomyocytes

Affiliations

Elevated levels of Letm1 drives mitochondrial dysfunction and cardiomyocyte stress-mediated apoptosis in cultured cardiomyocytes

Anushka Deshpande et al. Cell Commun Signal. .

Abstract

Background: Cardiac ischemia, a predominant cause of heart failure, is marked by profound mitochondrial dysfunction, dysregulated ion homeostasis, and maladaptive cellular remodeling, all of which compromise cardiac performance. The mitochondrial inner membrane protein Leucine zipper-EF-hand containing Transmembrane Protein 1 (Letm1), implicated in Wolf-Hirschhorn Syndrome, is essential for mitochondrial function. Although genetic alterations in Letm1 are linked to cardiomyopathies, its specific contributions to cardiac pathophysiology, particularly in the context of ischemic heart disease, remain poorly defined. This study aims to elucidate the role of Letm1 in ischemic cardiac pathology and its mechanistic impact on cardiomyocyte function.

Methods: Letm1 expression was assessed in human and murine models of heart failure due to ischemic cardiomyopathy (ICM) and cardiac hypertrophy. Letm1 was overexpressed in neonatal rat ventricular cardiomyocytes, adult mouse cardiomyocytes, and human induced pluripotent stem cell (iPSC)-derived cardiomyocytes to study mitochondrial function (Seahorse assays), structural and molecular remodeling (fluorescence microscopy, transmission electron microscopy (TEM), qPCR, immunoblotting), transcriptomic/proteomic profiles, calcium handling and electrophysiology (patch-clamp), autophagic flux (Bafilomycin A1, LC3-RFP-GFP), and cell survival.

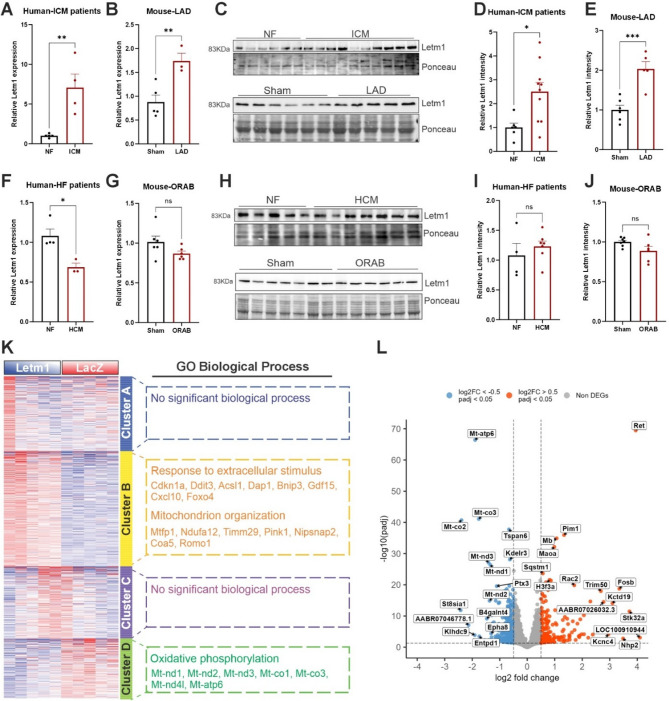
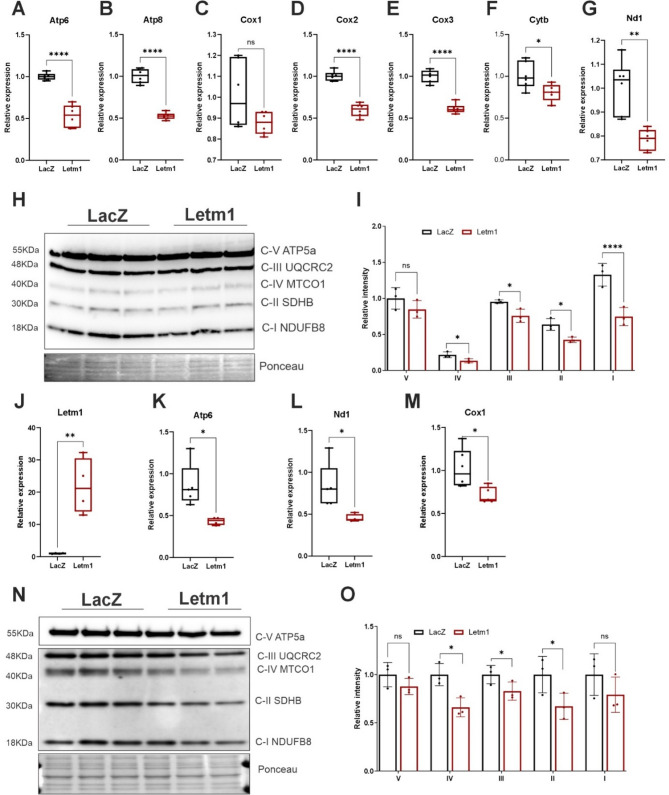
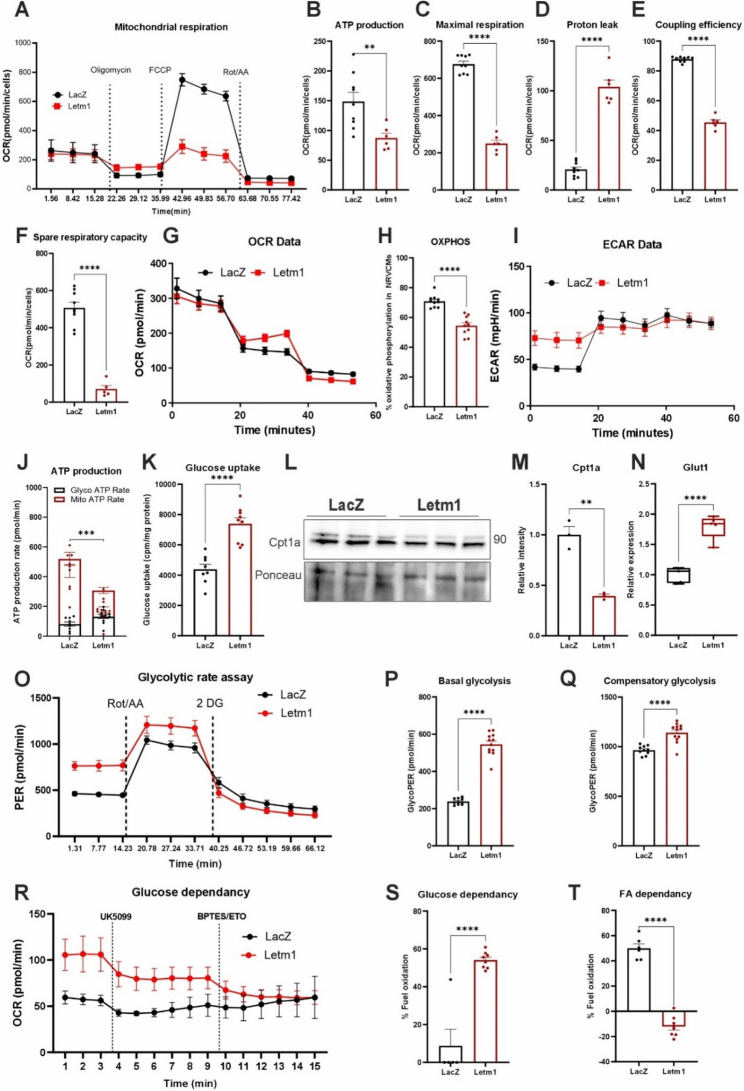
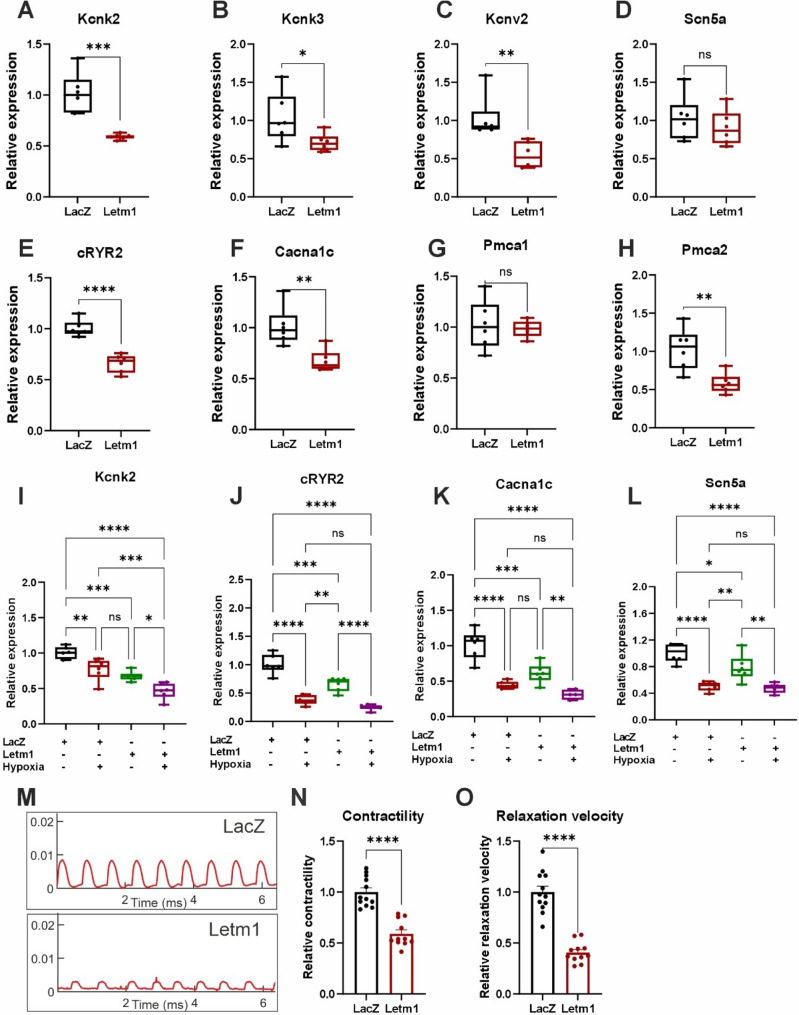
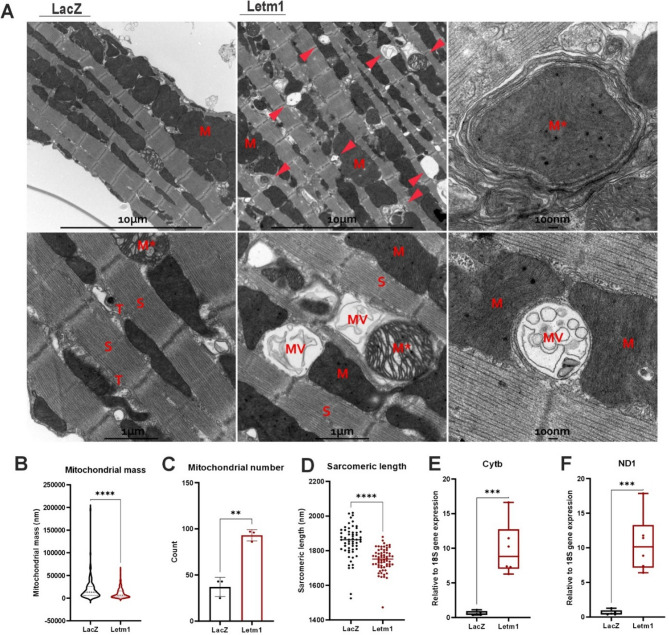
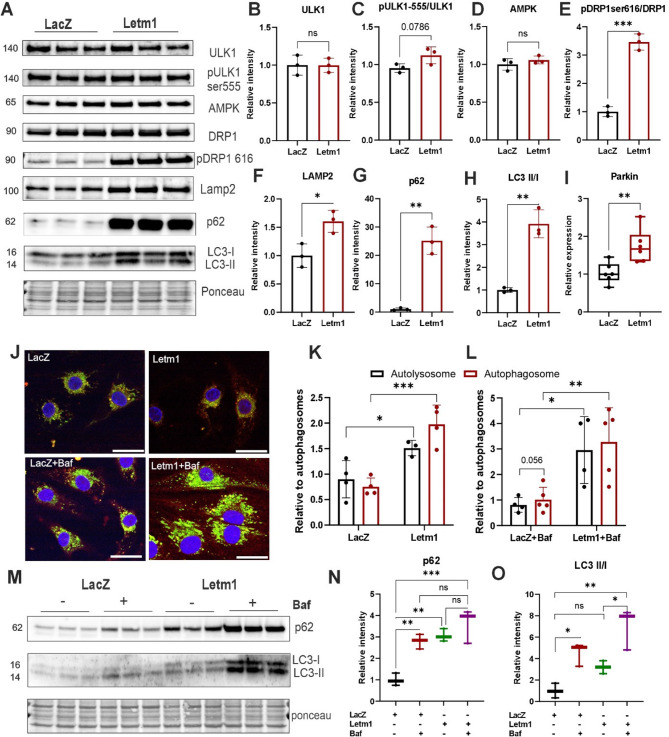
Results: Letm1 was markedly upregulated in ICM in both human and murine hearts, but unchanged in hypertrophic heart failure. Overexpression of Letm1 in cardiomyocytes resulted in profound mitochondrial dysfunction, including downregulation of oxidative phosphorylation (OXPHOS) genes, impaired membrane potential, reduced ATP output, increased proton leak, and elevated ROS levels. A metabolic shift toward glycolysis was observed, accompanied by reduced fatty acid oxidation. Electron microscopy revealed mitochondrial fragmentation, mitophagic vesicles, and sarcomeric disarray. Transcriptomic and proteomic analyses highlighted dysregulation of genes linked to mitochondrial organization, ion transport, and autophagy. Electrophysiologically, Letm1 reduced L-type Ca2+ current density and significantly shortened action potential duration, leading to impaired contractility. Letm1 overexpression activated upstream autophagy regulators (AMPK, ULK1) and enhanced LC3-II and p62 accumulation, but autophagic flux was impaired, as confirmed by LC3-RFP-GFP reporter and exacerbated by Bafilomycin A1 treatment. This dysregulated autophagy was coupled with mitochondrial stress, increased apoptosis (cleaved caspases), and reduced cardiomyocyte viability.

Conclusion: This study indicates that Letm1 upregulation drives mitochondrial dysfunction, electrophysiology alterations, and activation of autophagy and apoptosis, culminating in cardiomyocyte injury in ischemic cardiomyopathy. By disrupting OXPHOS, calcium handling, and cell survival pathways, Letm1 contributes to ischemic remodeling and cardiac dysfunction. Targeting Letm1 presents a promising therapeutic strategy to alleviate ischemic damage and preserve cardiac function.

Keywords: Arrhythmias; Cardiomyocytes; Hypertrophy; Letm1; Mitochondrial metabolism.


Conflict of interest statement

Declarations. Ethics approval and consent to participate: All animal experiments were performed according to international, institutional and governmental ethical guidelines. LAD mouse experiment was approved by the Ministry of Energy Transition, Agriculture, Environment, Nature and Digitalization (MELUND) of the state of Schleswig-Holstein (96 − 11/20) and ORAB mouse experiment was approved by the authorities of the Regierungspräsidium Karlsruhe (G-174/23). The use of human tissue samples conforms to the declaration of Helsinki and was approved by the ethical committee of the medical school of the Georg-August-University, Göttingen. Written informed consent was received from all participants prior to inclusion. Consent for publication: All authors declare consent for publication. Competing interests: The authors declare no competing interests.

Figures

Fig. 1
Fig. 1
Letm1 is upregulated in ischemic heart and dysregulates mitochondrial pathways in cultured cardiomyocytes. A. Graph showing transcript levels of ventricular Letm1 in human patients (n = 5 and ICM n = 4) (B) and mouse model (Sham n = 5, LAD n = 3) of ischemic cardiomyopathy compared to respective non-failing hearts. C. Protein levels of ventricular Letm1 in human patients (NF n = 5, ICM n = 10) and mouse model of ischemic cardiomyopathy (Sham n = 6, LAD n = 5) compared to respective non-failing hearts. Its densitometry is depicted in D and E, respectively. Transcript levels of ventricular Letm1 in human patients (NF n = 4, HCM n = 3) (F) and mouse model (n = 6 ORAB n = 6) (G) of cardiac hypertrophy compared to respective non-failing hearts. H. Protein levels of ventricular Letm1 in human patient and mouse model of cardiac hypertrophy compared to respective non-failing hearts(NF n = 5, HCM n = 7, Sham n = 7, ORAB n = 6). Its densitometry is depicted in I and J, respectively. K. Heatmap of differentially expressed genes upon Letm1 expression compared to LacZ control. L. Volcano plot highlights some of the significantly up- and down-regulated genes upon Letm1 expression compared to LacZ control. NF: non-failing; HCM: hypertrophic cardiomyopathy; ICM: Ischemic cardiomyopathy; LAD: left anterior descending artery ligation; ORAB: O-ring aortic bandin; GO: Gene ontology, Statistical significance is calculated by two-tailed Students’ t-test. *, p < 0.05; **, p < 0.01; ***, p < 0.001; ns, non-significant
Fig. 2
Fig. 2
Letm1 dysregulates OXPHOS gene expression and protein abundance in cultured cardiomyocytes. A-G. Transcript level detection of genes involved in oxidative phosphorylation complexes upon Letm1 expression. H. Immunoblot of oxidative phosphorylation (OXPHOS) complexes detected in total protein lysates and its desitometric analysis in (I). J-M Transcript level alteration of mitochondrial genes in iPS derived cardiomyocytes post elevated letm1 levels as compared to LacZ control. N. Immunoblot of oxidative phosphorylation (OXPHOS) complexes detected in total protein lysates from iPSC-derived cardiomyocytes and its densitometric analysis in (O). Statistical significance is calculated by two-tailed Students’ t-test. *, p < 0.05; **, p < 0.01; ***, p < 0.001; ****, p < 0.0001; ns, non-significant
Fig. 3
Fig. 3
Letm1 overexpression impairs mitochondrial bioenergetics and functional integrity in cardiomyocytes. A. Results from mitochondrial function assessment using seahorse metabolic assay (Mito Stress Test) performed in NRVCMs indicating oxygen consumption rate (OCR) for mitochondrial respiration (B) ATP production, (C) maximal respiration, (D) proton leak, and (E) coupling efficiency (F). Spare respiratory capacity, G. Oxygen consumption rate in the mito stress test assay. H. Oxidative phosphorylation calculated from the ATP rate assay detecting reduced levels upon Letm1 elevation, I. ECAR upon Letm1 elevation, J. ATP production graph plotted using measurements from ATP rate assay to calculate ATP obtained from mitochondrial vs. glycolysis pathway. K. Graph showing the results from glucose uptake assay for NRVCMs either expressing Letm1 or LacZ control. Immunoblot (L) and its densitometry (M) depicting Cpt1a levels in NRVCMs expressing Letm1 compared to LacZ control. N. Graph showing transcript levels of Glut1 in NRVCMs expressing Letm1 compared to LacZ control. O. Proton efflux rate from the glycolytic rate assay upon Letm1 overexpression. P. Elevated levels of basal glycolysis upon Letm1 overexpression as compared to control. Q. Increase in compensatory glycolysis upon Letm1 overexpression. R. Substrate utilization assay revealed glucose dependency as the main substrate utilized for ATP generation in Letm1 overexpressing cells. S. Increased % of glucose dependency of Letm1 overexpressing cells as compared to LacZ condition. T. Decreased % of fatty acid utilization of Letm1 overexpressing cells as compared to LacZ condition. ECAR; Extracellular acidification rate, OCR; oxygen consumption rate, PER; proton efflux rate. n = 3 for all experiments. Statistical significance is calculated by two-tailed Students’ t-test. *, p < 0.05; **, p < 0.01; ***, p < 0.001; ****, p < 0.0001; ns, non-significant
Fig. 4
Fig. 4
Elevated levels of Letm1 disrupts electrophysiology and contractility in cardiomyocytes. A Representative graphs of action potential measurements of cardiomyocytes expressing Letm1 as compared to LacZ control. B Graph plotted for action potential duration at 50% (B) and 90% (C) repolarization. D. L-type Calcium current density of cells with Letm1 vs. LacZ. E. Representative Calcium current measurements of Letm1 vs. LacZ expressing cells. F. Calculated Calcium current density. G. Sustained Potassium current of cells with Letm1 vs. LacZ. H. Representative sustained Potassium current measurements of Letm1 vs. LacZ expressing cells. I. Calculated Potassium current density. APD: action potential duration, n = 3. Statistical significance is calculated by two-tailed Students’ t-test. *, p < 0.05; **, p < 0.01; ns, non-significant
Fig. 5
Fig. 5
Letm1 expression disrupts contractility in cardiomyocytes. A-H. Transcript levels of genes involved in Potassium, sodium and Calcium ion transport in Letm1 expressing or LacZ expressing control NRVCMs. I.-L. Transcript levels of genes involved in Potassium, sodium and Calcium ion transport in Letm1 expressing or LacZ expressing control in NRVCMs under hypoxia condition as compared to normoxia condition. M. Representative images of the peaks obtained from cardiomyocyte contractility assay. N. Cardiomyocyte contractility calculated from the obtained data. O. Relaxation velocity of cardiomyocytes upon Letm1 expression. n = 3. Statistical significance is calculated by two-tailed Students’ t-test. *, p < 0.05; **, p < 0.01; ***, p < 0.001; ****, p < 0.0001; ns, non-significant
Fig. 6
Fig. 6
Letm1 overexpression alters mitochondrial ultrastructure and sarcomeric organization in adult cardiomyocytes. A Representative electron microscopy images of Letm1 overexpressing adult cardiomyocytes as compared to LacZ expressing control. In overviews (10 μm scale), cardiomyocytes with Letm-1 overexpression feature large vacuoles typically at the Z-level of sarcomeres (arrowheads). Images at higher magnification (1 μm scale) demonstrate disturbance of the Membrane-system in Letm1 condition as compared to LacZ control (T, sarcoplasmic T-tubule system), containing multivesicles (MV) and cellular content, including mitochondria (M), reminiscent of autophagosomes. The detailed view (100 nm scale) in the upper panel depicts defective mitochondria inside a vesicle (M*) and in the lower panel healthy mitochondria and multivesicular body (MV) between two regular mitochondria (M). S; sarcomere, M; mitochondria, M*; defective mitochondria, T; T tubules. B Reduced mitochondrial mass was observed in Letm1 overexpressing cells as compared to control cell. C Mitochondrial number was observed to be increased in count upon Letm1 overexpression. D Sarcomeric length was significantly reduced in cells overexpressing Letm1, E, F. Quantitative mitochondrial DNA copy number was determined using realtime PCR of mitochondrial to nuclear genes at DNA level. n = 3. Statistical significance is calculated by two-tailed Students’ t-test. *, p < 0.05; **, p < 0.01; ***, p < 0.001; ****, p < 0.0001; ns, non-significant
Fig. 7
Fig. 7
Letm1 overexpression activates autophagy but impairs lysosomal clearance. A. Immunoblots indicating different markers for AMPK-ULK1 signaling pathway and autophagy in Letm1 overexpressing NRVCMs as compared to LacZ control condition along with their respective densitometric analysis in (B-H). I. Increased transcript level of Parkin upon Letm1 elevation. J. Representative images of Tandem LC3-GFP-RFP imaging in cells with increased Letm1 in combination with BafilomycinA1 treatment and its respective analysis in K, L. M. Immunoblots indicating p62 and LC3 levels upon Letm1 overexpression as compared to LacZ control in presence and absence of Bafilomycin A1 treatment and its respective densitometric analysis in N, O respectively. Baf; BafilomycinA1. n = 3. Statistical significance is calculated by two-tailed Students’ t-test or 2-way ANOVA. *, p < 0.05; **, p < 0.01; ***, p < 0.001; ****, p < 0.0001; ns, non-significant
Fig. 8
Fig. 8
Letm1 overexpression impairs cardiomyocyte survival, and stress response via mitochondrial dysfunction and increased apoptosis. A. Representative immunofluorescence images of cardiomyocytes stained with α-actinin and DAPI (scalebar 50 μm) for cell surface area measurement and it analysis is shown in (B). Transcript levels of Nppa (C) and Nppb (D), in cardiomyocytes with either Letm1 or LacZ overexpression. E. Representative immunofluorescence images of cardiomyocytes stained with TMRE (Scalebar 50 μm) for mitochondrial membrane potential measurements depicted in (F). G. Cardiomyocyte cell viability detected by MTT assay. H. Immunoblots detecting Caspase 3 and its cleaved fragment as well as Caspase 7 and its cleaved fragment. Its densitometry measurements are depicted in I, respectively. n = 3 for every experiment. Statistical significance is calculated by two-tailed Students’ t-test. *, p < 0.05; **, p < 0.01; ***, p < 0.001; ****, p < 0.0001; ns, non-significant

References

    1. Vaduganathan M, Mensah GA, Turco JV, Fuster V, Roth GA. The global burden of cardiovascular diseases and risk: A compass for future health. J Am Coll Cardiol. 2022;80:2361–71. 10.1016/j.jacc.2022.11.005. - PubMed
    1. Khan MA, et al. Global Epidemiology of Ischemic Heart Disease: Results from the Global Burden of Disease Study. Cureus. 2020;12:e9349. 10.7759/cureus.9349. - PMC - PubMed
    1. Simonson B, et al. Single-nucleus RNA sequencing in ischemic cardiomyopathy reveals common transcriptional profile underlying end-stage heart failure. Cell Rep. 2023;42:112086. 10.1016/j.celrep.2023.112086. - PMC - PubMed
    1. Chang X, et al. Molecular mechanisms of mitochondrial quality control in ischemic cardiomyopathy. Int J Biol Sci. 2023;19:426–48. 10.7150/ijbs.76223. - PMC - PubMed
    1. Nguyen BY, et al. Mitochondrial function in the heart: the insight into mechanisms and therapeutic potentials. Br J Pharmacol. 2019;176:4302–18. 10.1111/bph.14431. - PMC - PubMed

LinkOut - more resources