. 2025 Aug 23;22(1):205.
doi: 10.1186/s12974-025-03514-3.

Single-cell transcriptomic landscape of sciatic nerve after transection injury

Affiliations

Single-cell transcriptomic landscape of sciatic nerve after transection injury

Yiben Ouyang et al. J Neuroinflammation. .

Abstract

Peripheral nerve injuries, particularly those affecting the sciatic nerve, often result in incomplete functional recovery due to the limited regenerative capacity of adult peripheral nerves. To elucidate the cellular and molecular mechanisms underlying nerve regeneration, we performed single-cell RNA sequencing (scRNA-seq) on rat sciatic nerve tissues at seven time points (Days 0, 1, 3, 5, 7, 10, and 14) following transection injury. Through unsupervised clustering, we identified four major cellular compartments-neurofibroblasts (NFs), glial cells (Glis), immune cells, and vascular cells-and delineated their dynamic trajectories during regeneration. Early responses were dominated by macrophage (Mac) and granulocyte infiltration (Day 1), followed by proliferative expansion of proliferating mesenchymal fibroblasts (NF5) and repair Schwann cells (Gli0) by Days 3-5. Vascular remodeling commenced from Day 7, while Glis progressively transitioned to mature myelinating states (Gli2/Gli5) by Day 14. Pseudotime analysis revealed subtype-specific reprogramming in both Macs and Glis, and cell-cell communication analysis uncovered key ligand-receptor interactions-particularly collagen and PTN signaling between Macs, NFs, and Glis. Bulk transcriptomic validation confirmed sustained and spatially distinct activation of the TGF-[Formula: see text] signaling pathway across cell types and anatomical locations. Comparative analysis with a sciatic nerve crush injury model revealed a stronger early immune response and delayed Gli recovery in transection injury, indicating a narrowed therapeutic window. Together, this work provides a time-resolved single-cell atlas of peripheral nerve regeneration, defines key regulatory circuits within the immune-NF-Gli axis, and identifies phase-specific therapeutic targets-such as early Mac heterogeneity, NF4-mediated matrix remodeling, and Schwann cell remyelination-for enhancing functional recovery following severe nerve injury.

Keywords: TGF−β signaling; Glial cell reprogramming; Macrophage heterogeneity; Nerve regeneration; Neurofibroblast–glia interaction; Sciatic nerve transection; Single−cell RNA−seq.


Conflict of interest statement

Declarations. Ethics approval: All experimental procedures involving animals were approved by the International Council for Laboratory Animal Science and conducted in accordance with guidelines for the care and use of laboratory animals. Efforts were made to minimize animal suffering and reduce the number of animals used in the study. All procedures were approved by the Institutional Animal Care and Use Committee of PLA General Hospital (approval number: 2023‑x4‑19) and conformed to national guidelines for animal care. Competing interests: The authors declare no competing interests.

Figures
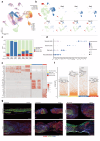
Fig. 1
Fig. 1
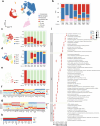
Temporal Cell Type Heterogeneity Following Sciatic Nerve Transection. (a) UMAP visualization of integrated single–cell RNA sequencing (scRNA–seq) data across different post–injury time points. Each dot represents a single cell, colored by time point. (b) Left: UMAP showing clustering into four major cell types—neurofibroblasts (NFs), immune cells, glial cells (Glis), and vascular cells. Right: Cell type distribution across time points. (c) Bar plot of relative cell type proportions at each time point. (d) Dot plot of canonical marker genes across cell types. Dot size represents the proportion of cells expressing each gene (≥ 1 UMI); color indicates average expression level. (e) Heatmap of differentially expressed genes (DEGs) among primary cell types. Red: high expression; gray: low expression. (f) Volcano plots of DEGs for each major cell type. Top 10 DEGs are labeled; y–axis shows log₂ fold change (log₂FC). (g) Immunofluorescence staining for S100 (red, Schwann cells) and NF200 (green, axons) in uninjured and injured sciatic nerves (Days 3, 5, 7, 10, 14), showing spatiotemporal changes in Gli activity and axonal structure. Scale bar: 500 μm
Fig. 2
Fig. 2
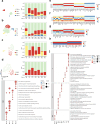
Clustering and Functional Profiling of Myeloid Immune Subtypes. (a) UMAP plot showing immune cell types across all time points: granulocytes (Grans), macrophages (Macs), monocytes (Mos), dendritic cells (DCs), T cells, B cells, and NK cells. (b) Bar plot of immune cell type proportions over time. (ce) Unsupervised subclustering of myeloid cells. Left: UMAP of subtypes; Right: temporal distribution. (c) Gran0–Gran3. (d) Mac0–Mac4. (e) Mo0–Mo1. (fh) Heatmaps of upregulated marker genes (Z–score, log scale) for each subtype. (f) Grans, (g) Macs, (h) Mos. (i) GO enrichment analysis of each Gran, Mac, and Mo subtype
Fig. 3
Fig. 3
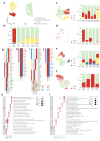
Clustering and Functional Profiling of DC and Lymphoid Subtypes. (ad) Unsupervised subclustering of lymphoid and DC subtypes. Left: UMAP; Right: temporal proportions. (a) Dendritic cells: DC0–DC3. (b) T cells: T0–T3. (c) B cells: B0–B2. (d) NK cells: NK0–NK1. (eh) Heatmaps of upregulated marker genes (Z–score, log) for each subtype. (e) DCs, (f) T cells, (g) B cells, (h) NK cells. (ij) GO enrichment analysis. (i) DC subtypes. (j) T, B, and NK cell subtypes
Fig. 4
Fig. 4
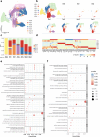
Mo–to–Mac Trajectories and Cell–Cell Interactions. (a) UMAP clustering of Mos and Macs with annotated subtypes. (b) Chord diagram of CellChat–inferred collagen signaling between Macs and NFs at different time points. Edge thickness: interaction strength; color: sender cluster. (c, f) Slingshot trajectory analysis showing pseudotime for trajectories 1 and 2. (d, g) Density plots of Mac and Mo subtypes along each pseudotime trajectory. (e, h) Smoothed expression dynamics of representative genes along pseudotime (GAM fitting). Each dot represents a single cell, colored by its corresponding time point
Fig. 5
Fig. 5
Vascular Cell Subtypes and Functional Characteristics. (a) UMAP clustering of vascular cells into four types: endothelial cells (ECs), lymphatic ECs (lyECs), pericytes (PCs), and smooth muscle cells (SMCs). (b) Bar plot of vascular cell type proportions over time. (cf) Subclustering of vascular types. Left: UMAP; Right: subtype proportions over time. (c) EC0–EC2. (d) lyEC0–lyEC1. (e) PC0–PC3. (f) SMC0–SMC1. (gj) Heatmaps of upregulated markers (Z–score, log) per subtype. (g) ECs, (h) lyECs, (i) PCs, (j) SMCs. (kl) GO enrichment results. (k) EC and lyEC subtypes. (l) PC and SMC subtypes
Fig. 6
Fig. 6
Neurofibroblast Subtype Dynamics During Nerve Repair. (a) UMAP of NFs across time points. (b) Left: Subtype clustering of NF0–NF6. Right: Temporal distribution of each subtype. (c) Proportional changes in NF subtypes post–injury. (d) Heatmap of upregulated marker genes (Z–score, log). (e) GO enrichment of NF subtypes. (f) GO enrichment of glial subtypes (Gli0–Gli5) for comparison
Fig. 7
Fig. 7
Glial Cell Subtype Differentiation and Signaling Activity. (a) UMAP of Glis across time points. (b) Left: Subtype clustering of Gli0–Gli5. Right: Distribution over time. (c) Changes in Gli subtype proportions post–injury. (d) Heatmap of upregulated markers (Z–score, log). (e) Pseudotime trajectories from Day 5–14 identifying two distinct differentiation paths. (f) Heatmaps of variable gene expression along each trajectory. (g) Density plots of cell distributions along trajectories. (h) Bubble plots of pathway activation over pseudotime. (i) CellChat chord diagram of PTN signaling from Gli to NF cells. (j) Bubble plot showing predicted Gli–to–NF signaling interactions by pathway
Fig. 8
Fig. 8
Region – and Time–Resolved Bulk Transcriptomic Profiling of TGF–formula image signaling after nerve transection. (a) Scatter plots comparing log₂FC in proximal vs. distal segments (relative to uninjured controls) at Days 1, 3, 5, 7, and 14. Red: genes upregulated in both; green: downregulated in both. Labeled genes are TGF–formula image–related and significantly changed in both regions. (b) GO enrichment of genes from (a), categorized as shared, proximal–specific, or distal–specific upregulated genes. (c) GSEA heatmap of normalized enrichment scores (NES) for TGF–formula image–related pathways across regions and time points. (d) Heatmap of key TGF–formula image signaling components (ligands, receptors, mediators, targets) across regions and time points (Z–score, log). (e) Immunofluorescence staining of TGF–formula image in uninjured and injured nerves (Days 3–14), showing spatial–temporal changes in protein expression. Scale bar: 500 μm
Fig. 9
Fig. 9
Comparative Analysis of Crush vs. Transection Injuries in Single–Cell Resolution. (a) UMAP of cells from sciatic nerve crush injury (SNCI) and transection injury (SNTI) at Days 0, 1, 3, 7. (b) Cell type annotation using SingleR with the Injured Sciatic Nerve Atlas (iSNAT) as reference. (cd) UMAPs of SNCI (c) and SNTI (d) separately, colored by cell type. (e) Bar plot comparing cell type proportions between SNCI and SNTI at each time point. (f) Scatter plots of DEGs (log₂FC > ± 1, FDR < 0.05) in SNCI vs. SNTI at Days 1, 3, 7. Red: downregulated in both; green: upregulated in both. (g) GO enrichment of commonly upregulated genes (green in f). (h) GO enrichment of injury–specific genes (log₂FC > 1 in only SNCI or SNTI)

References

    1. Arbash M, Alzobi OZ, Salameh M, Alkhayarin M, Ahmed G. Incidence, risk factors, and prognosis of sciatic nerve injury in acetabular fractures: a retrospective cross-sectional study. Int Orthop. 2024;48:849–56. - PMC - PubMed
    1. Liu Z, Fu B, Xu W, Liu F, Dong J, Li L, Zhou D, Hao Z, Lu S. Incidence of traumatic sciatic nerve injury in association with acetabular fracture: a retrospective observational single-center study. Int J Gen Med. 2022;15:7417–25. - PMC - PubMed
    1. Callaghan BC, Cheng HT, Stables CL, Smith AL, Feldman EL. Diabetic neuropathy: clinical manifestations and current treatments. Lancet Neurol. 2012;11:521–34. - PMC - PubMed
    1. Vieira AS, Baptista AF, Mendes L, Silva KS, Gois SC, Lima FM, Souza I, Sa KN. Impact of neuropathic pain at the population level. J Clin Med Res. 2014;6:111–9. - PMC - PubMed
    1. Litovchenko TA, Borodai OM, Tondiy OL. Quality of life of patients with post-traumatic neuropathies and plexopathies accompanied by chronic neuropathic pain syndrome. Int Neurol J. 2021;17:21–4.

LinkOut - more resources