

Enhancing PQQ production in Acinetobacter calcoaceticus through uniform design and support vector regression
- PMID: 40851861
- PMCID: PMC12367485
- DOI: 10.3389/fmicb.2025.1556322
Enhancing PQQ production in Acinetobacter calcoaceticus through uniform design and support vector regression
Abstract
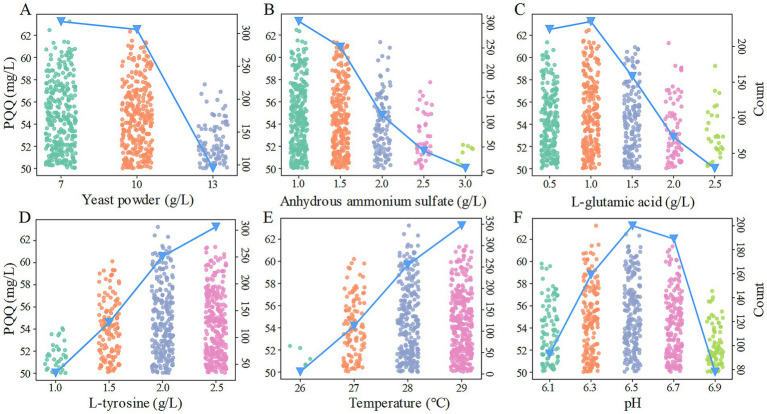
A novel machine learning-assisted approach for formula optimization, termed UD-SVR, is introduced by combining uniform design with support vector regression. This method was employed to optimize both the formulation and fermentation conditions for pyrroloquinoline quinone (PQQ) production by Acinetobacter calcoaceticus. In just two rounds of 66 experimental treatments, UD-SVR effectively optimized a formulation involving eight factors at the shake-out level scale, enhancing PQQ production from 43.65 mg/L to 73.40 mg/L-an impressive 68.15% increase. Notably, the optimized formulation is also cost-effective, featuring minimized consumption of pivotal elements like carbon and nitrogen sources. The machine learning-supported UD-SVR method presents an inclusive resolution for optimizing experimental designs and analyses in multi-factor, multi-level formulations, characterized by robust guidance, lucid interpretability, and heightened efficiency in optimization.
Keywords: Acinetobacter calcoaceticus; PQQ; formulation optimization; support vector regression; uniform design.
Copyright © 2025 Li, Yao, Zhou, He, Yuan, Hu, Shen, Li and Chen.
Conflict of interest statement
The authors declare that the research was conducted in the absence of any commercial or financial relationships that could be construed as a potential conflict of interest.
Figures
References
-
- Che J., Yang Y., Li L., Li Y., Zhu S. (2017). A modified support vector regression: integrated selection of training subset and model. Appl. Soft Comput. 53, 308–322. doi: 10.1016/j.asoc.2016.12.053 - DOI
-
- Fang F., Zang G. L., Sun M., Yu H. Q. (2013). Optimizing multi-variables of microbial fuel cell for electricity generation with an integrated modeling and experimental approach. Appl. Energ. 110, 98–103. doi: 10.1016/j.apenergy.2013.04.017 - DOI
LinkOut - more resources
Full Text Sources