. 2025 Oct 6;64(41):e202508528.
doi: 10.1002/anie.202508528. Epub 2025 Aug 25.

A Photoresponsive Hybrid of Viruses and Supramolecular Peptide Fibers for Multidimensional Control of Patterning and Infection

Affiliations

A Photoresponsive Hybrid of Viruses and Supramolecular Peptide Fibers for Multidimensional Control of Patterning and Infection

Atsuya Yaguchi et al. Angew Chem Int Ed Engl. .

Abstract

Viruses are versatile colloidal materials in their biofunctions, monodispersed and periodic structures, and high surface designability. For expanding the applicability of virus-based materials, spatiotemporally controlled immobilization and dispersion of viruses with retained activity should be useful, though control of the dynamic nature of viruses hybridized with commonly used polymers has been difficult due to their strong interactions. Here, we report a self-assembling peptide (A2Az) enabling photo control of adhesion and dispersion of M13 bacteriophage virus (M13 phage) and successfully demonstrate patterning of localization and infection of the virus. A2Az is a cationic peptide with amphiphilicity that consists of eight amino acid residues containing a photo-responsive azobenzene group at the second position and self-assembles into a helical supramolecular fiber to form a hydrogel. The helical fibrillar morphology of A2Az exhibits strong interaction with M13 phage, allowing for immobilization not only on a two-dimensional surface but also in a three-dimensional hydrogel with suppression of infectivity. The A2Az fiber undergoes a light-triggered fiber-to-particle transition and releases the immobilized M13 phage with retained infectivity for the photo-controlled patterning of localization and infection. This approach has potential applicability to various virus-based biomaterials, such as structural materials and materials for photo-selective gene transfection to cells.

Keywords: Gels; Peptides; Polymers; Supramolecular chemistry; Viruses.


Conflict of interest statement

The authors declare no conflict of interest.

Figures
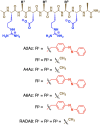
Figure 1
Figure 1
Molecular structures of A2Az, A4Az, and A6Az containing a trans‐form of the azobenzene (Az) group, and RADA8.
Figure 2
Figure 2
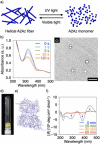
Schematic illustration of the concept of the photoresponsive virus and A2Az hybrid. The helical A2Az fiber effectively hybridizes with the virus, which is then released by UV‐induced depolymerization of the A2Az fiber by trans‐to‐cis isomerization of the Az group.
Figure 3
Figure 3
a) and b) Snapshot (a) and distribution of the particle center of mass (b) of the supramolecular structure of the A2Az fiber in water at 300 K, as calculated by all‐atom molecular dynamics (MD) simulations. c) Photograph of the hydrogel of the A2Az fiber (1.0 wt%) containing trifluoroacetic acid (TFA; 2.2 v/v%) at 20 °C. d) Transmission electron micrograph (TEM) of the A2Az fibers. The inset shows a higher magnification image. Scale bars: 100 and 50 nm (inset). Samples were negatively stained with uranyl acetate. e) Atomic force microscopy (AFM) image with height profile of the A2Az fiber. Scale bar: 20 nm. Dashed line indicates the region of the height profile. f) Circular dichroism (CD) spectrum of the A2Az fiber (1.0 wt%) in water containing TFA (2.2 v/v%) at 20 °C. g) Plausible Az stacking in parallel β‐sheets. The hydrophilic region, the hydrophobic region, and the Az group of A2Az are highlighted as blue, cream, and red, respectively.
Figure 4
Figure 4
a)–c) TEM images of RADA16 fibrils (a), A4Az fibrils (b), and A2Az helical fibers (c). Scale bars: 100 nm. d)–f) Photographs of glass substrates coated with RADA16 fibril (d), A4Az fibril (e), and A2Az fiber (f). Scale bars: 2 mm. g)–i) Confocal laser scanning microscopic (CLSM) images (λ ex = 647 nm, λ obs  = 650–750 nm) of the glass substrates coated with RADA16 fibril (g), A4Az fibril (h), and A2Az fiber (i) after incubation with Cy5‐labled M13 phage (M13 phageCy5, 17.9 × 1011 virions mL−1). Scale bars: 100 µm. j)–l) Photographs of 5‐bromo‐4‐chloro‐3‐indolyl β‐D‐galactopyranoside (X‐gal) plates after plaque assays for M13 phage adsorbed to RADA16 fibril‐(j), A4Az fibril‐(k), and A2Az fiber‐coated glass substates (l). Insets: magnified images of the X‐gal plates; plaques of M13 phage‐infected E. coli are indicated by blue circles. m) Differential scanning calorimetry (DSC) traces of 1.0 wt% hydrogel samples of RADA16 fibrils (orange), A4Az fibrils (brown), and A2Az fibers (blue). n) Infrared (IR) spectra of 1.0 wt% hydrogel samples of RADA16 fibrils (orange), A4Az fibrils (brown), and A2Az fibers (blue).
Figure 5
Figure 5
a) Schematic illustration of the transition of A2Az helical fiber to the monomer by UV‐induced isomerization of the Az group. b) UV–vis absorption spectral change of A2Az (0.7 wt% in water containing TFA (2.2 v/v%)) upon irradiation with 350‐nm light for 0 s (blue), 1s (light blue), 5 s (green), 30 s (orange), and 120 s (red). c) TEM image of A2Az (0.7 wt%) in water containing TFA (2.2 v/v%) after irradiation with 350‐nm light for 20 min. Scale bar: 100 nm. The TEM sample was stained with uranyl acetate. d) Photograph of the dispersion of A2Az (0.7 wt%) after irradiation with 350‐nm light for 20 min. e) Snapshot of the supramolecular structure of A2Az containing the cis‐form of the Az group in water at 300 K, as calculated by all‐atom MD simulation. f) CD spectral change of A2Az (0.7 wt% in water containing TFA (2.2 v/v%)) upon irradiation with 350‐nm light for 0 min (blue), 20 min (green), 40 min (orange), and 60 min (red). Arrows indicate the directions of spectral change.
Figure 6
Figure 6
a)–c) Schematic illustrations of photo‐selective dissociation of M13 phageCy5/A2Az‐coated glass substrate. Step 1: Adhesion of M13 phageCy5 to the A2Az‐coated glass substrate (a), Step 2: Ultraviolet (UV) light (λ = 350 nm, Xenon lamp) irradiation of the M13 phageCy5‐adhered glass substrate half‐masked with aluminum foil for 40 min (b), Step 3: Rinse of M13 phageCy5 on the glass substrate (c). d)–f) Photographs of the glass substrate at Step 1 (d), Step 2 (e), and Step 3 (f). g) and h) CLSM (λ ex = 647 nm, λ obs = 650–750 nm) images of the glass substrate in Step 1 (g) and Step 3 (h). Scale bars: 50 µm. i) Phase‐contrast image of A2Az‐coated glass substrate containing gold nanoparticles hybridized with gold‐binding M13 phage (M13 phageAu) after site‐selective UV light irradiation (λ = 370 nm, U‐HGLGPS lamp). The inset shows a higher magnification image of the area of dashed square. Scale bars: 10 and 2 µm (inset). j)–o) Phase‐contrast microscopic (j,l,n) and CLSM (λ ex = 647 nm, λ obs= 650–750 nm) images (k,m,o) of M13 phageCy5‐adhered glass substrate after site‐selective UV light irradiation for 1 (j,k), 3 (l,m), and 5s (n,o) (λ = 370 nm, U‐HGLGPS lamp). Scale bars: 100 µm.
Figure 7
Figure 7
a) Schematic illustration of the photo‐induced infection of M13 phage in A2Az hydrogel. Photographs of an A2Az (0.4 wt%) hydrogel containing M13 phage (1.3 × 1011 virions mL−1), E. coli cells, and SPiDER‐βGal (0.6 µg mL−1) under 500‐nm excitation light b) before and c) after 350‐nm light irradiation (Xenon lamp) for 30 s followed by incubation for 7 days at 37 °C. d) Fluorescent spectra (λ ex = 500 nm) of the nonirradiated hydrogel before (blue curve) and after (green curve) incubation, and the hydrogel irradiated with 350‐nm light (Xenon lamp) for 30 s followed by incubation for 7 days at 37 °C (red curve). e) The amount of M13 phage evaluated by the plaque assay in A2Az hydrogel before (blue) and after (green) 7‐day incubation, and after incubation following the 350‐nm light (Xenon lamp) irradiation for 30 s (red). f) and g) Bright‐field image (f) and three‐dimensional CLSM image (λ ex = 488 nm, λ obs = 500–650 nm) of SPiDER dye‐associated fluorescence g) of an A2Az (0.5 wt%) hydrogel containing M13 phage (1.3 × 1011 virions mL−1) and E. coli cells; fluorescence (yellow) was observed exclusively in the region where the hydrogel had been irradiated with 370‐nm light for 5 s (U‐HGLGPS lamp). Scale bars: 100 µm.

References

    1. Wen A. M., Steinmetz N. F., Chem. Soc. Rev. 2016, 45, 4074–4126. - PMC - PubMed
    1. Brun M. J., Gomez E. J., Suh J., J. Controlled Release. 2017, 267, 80–89. - PMC - PubMed
    1. Fischlechner M., Donath E., Angew. Chem. Int. Ed. 2007, 46, 3184–3193. - PubMed
    1. Kostiainen M. A., Kasyutich O., Cornelissen J. J. L. M., Nolte R. J. M., Nat. Chem. 2010, 2, 394–399. - PubMed
    1. Kim P.‐H., Kim T.‐I., Yockman J. W., Kim S. W., Yun C.‐O., Biomaterials. 2010, 31, 1865–1874. - PubMed

LinkOut - more resources