

Interpretable machine learning model for predicting myocardial injury in intensive care unit patients using SHapley Additive exPlanations analysis
- PMID: 40853218
- PMCID: PMC12378537
- DOI: 10.1177/00368504251370452
Interpretable machine learning model for predicting myocardial injury in intensive care unit patients using SHapley Additive exPlanations analysis
Abstract
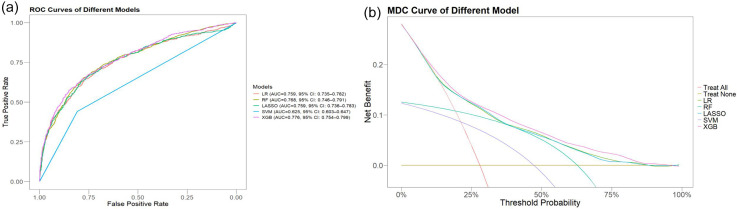
ObjectiveThe identification of myocardial injury in the intensive care unit (ICU) has received little attention from researchers. Therefore, this retrospective cohort study aimed to develop a machine-learning model to predict the occurrence of myocardial injury in the ICU.MethodsBased on the Clinical Research Data Platform of Peking University People's Hospital, we enrolled adult, non-cardiac surgical, and non-obstetric patients who were admitted to the ICU between 2012 and 2022. Logistic regression, random forest, LASSO regression, support vector machine and extreme gradient boosting (XGBoost) models were developed to predict myocardial injury.ResultsData from 7453 non-cardiac surgery adult patients in ICU were collected in the derivation cohort (myocardial injury group: 2161 [29%], non-myocardial injury group: 5292 [71%]). Among the five models, the XGBoost model (area under the curve = 0.779; accuracy = 0.781) exhibited the best predictive performance for myocardial injury and the results were explained by the SHapley Additive exPlanations analysis. The top six features of the XGBoost model were maximal heart rate, respiratory rate, temperature, minimal heart rate, age and plasma transfusion.ConclusionThis machine-learning model, developed using the XGBoost algorithm, could be a valuable tool for clinical decision-making and detecting myocardial injury in the ICU.
Keywords: Intensive care unit; SHapley Additive exPlanations; machine learning; myocardial injury; non-cardiac surgery.
Conflict of interest statement
Declaration of conflicting interestsThe authors declared no potential conflicts of interest with respect to the research, authorship and/or publication of this article.
Figures


Similar articles
-
Supervised Machine Learning Models for Predicting Sepsis-Associated Liver Injury in Patients With Sepsis: Development and Validation Study Based on a Multicenter Cohort Study.J Med Internet Res. 2025 May 26;27:e66733. doi: 10.2196/66733. J Med Internet Res. 2025. PMID: 40418571 Free PMC article.
-
Predicting Episodes of Hypovigilance in Intensive Care Units Using Routine Physiological Parameters and Artificial Intelligence: Derivation Study.JMIR AI. 2025 Aug 27;4:e60885. doi: 10.2196/60885. JMIR AI. 2025. PMID: 40864885 Free PMC article.
-
Interpretable prediction of hospital mortality in bleeding critically ill patients based on machine learning and SHAP.BMC Med Inform Decis Mak. 2025 Jul 15;25(1):263. doi: 10.1186/s12911-025-03101-9. BMC Med Inform Decis Mak. 2025. PMID: 40665292 Free PMC article.
-
INTERPRETABLE MACHINE LEARNING FOR PREDICTING RISK OF INVASIVE FUNGAL INFECTION IN CRITICALLY ILL PATIENTS IN THE INTENSIVE CARE UNIT: A RETROSPECTIVE COHORT STUDY BASED ON MIMIC-IV DATABASE.Shock. 2024 Jun 1;61(6):817-827. doi: 10.1097/SHK.0000000000002312. Epub 2024 Feb 20. Shock. 2024. PMID: 38407989
-
Serum calcium-based interpretable machine learning model for predicting anastomotic leakage after rectal cancer resection: A multi-center study.World J Gastroenterol. 2025 May 21;31(19):105283. doi: 10.3748/wjg.v31.i19.105283. World J Gastroenterol. 2025. PMID: 40497096 Free PMC article.
References
-
- Guest TM, Ramanathan AV, Tuteur PG, et al. Myocardial injury in critically ill patients. a frequently unrecognized complication. JAMA 1995; 273: 1945–1949. - PubMed
-
- Puelacher C, Lurati Buse G, Seeberger D, et al. Perioperative myocardial injury after noncardiac surgery: incidence, mortality, and characterization. Circulation 2018; 137: 1221–1232. - PubMed
MeSH terms
LinkOut - more resources
Full Text Sources
