. 2025 Aug 25;16(1):1615.
doi: 10.1007/s12672-025-03437-8.

Investigating the interaction of ACKR1 and c-Myc in the breast carcinoma tumor microenvironment modulation

Affiliations

Investigating the interaction of ACKR1 and c-Myc in the breast carcinoma tumor microenvironment modulation

Joyeeta Talukdar et al. Discov Oncol. .

Abstract

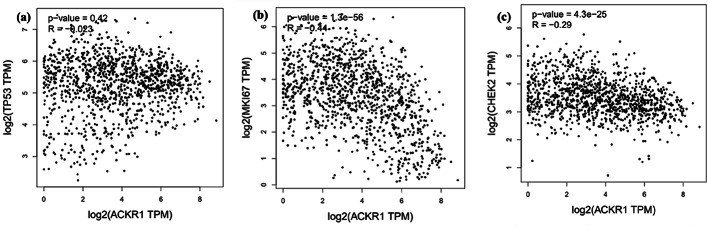
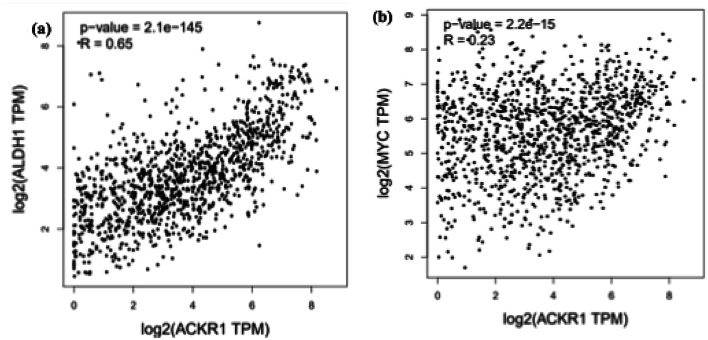
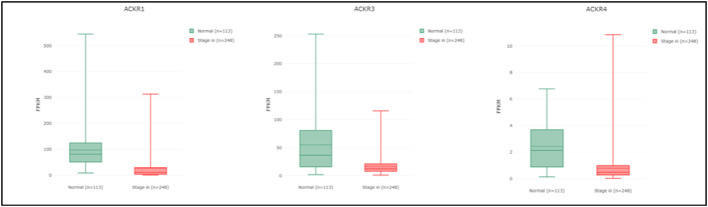
This study investigates the interplay between the Atypical chemokine receptors (ACKR1)/Decoy receptor for chemokines (DARC) and key molecular markers, including CCL8, c-MYC, ALDH1, and CHEK2, in breast cancer. DARC has been implicated in various aspects of cancer progression, including tumor growth, angiogenesis, and metastasis. By analyzing the expression patterns of these markers in breast cancer tissues, we aim to understand their collective impact on tumor behaviour and identify potential therapeutic targets. Our findings reveal complex interactions between DARC and these molecular markers, suggesting their synergistic roles in promoting or repressing breast cancer progression. Understanding these relationships could lead to developing more effective and personalized therapeutic strategies.


Conflict of interest statement

Declarations. Ethics approval and consent to participate: Participation in the study was voluntary, and verbal and written informed consent was obtained before enrolment. This study was performed in line with the principles of the Declaration of Helsinki. Approval was granted by the Ethics Committee of All India Institute of Medical Sciences (IEC-759/07.10.2022, RP-07/2022). Competing interests: The authors declare no competing interests.

Figures

Fig. 1
Fig. 1
ACKR1 and Isoform Expression in Breast Cancer. The figures display ACKR1 expression across cancer types and its isoforms in breast cancer specifically. a Presents a scatter plot of ACKR1 expression (TPM values) in various color-coded cancer types, with median expression indicated by horizontal black lines. In breast cancer, higher ACKR1 expression correlates with poorer prognosis, suggesting its involvement in tumor progression. b Shows that ACKR1-001 and ACKR1-002 are the predominant isoforms in breast cancer tissue, with ACKR1-003 and ACKR1-201 expressed at lower levels
Fig. 2
Fig. 2
DARC Upregulation Associated with Aggressive Breast Cancer. Analysis of ACKR1 expression in breast cancer (BRCA) comparing tumor vs. normal tissues and disease stages: a Scatter plot showing ACKR1 expression (TPM) across individual samples with tumor (red dots) and normal tissues (green dots), indicating expression differences between these groups. b Box plot demonstrates statistically significant upregulation of ACKR1 in tumor samples (red box) compared to normal samples (gray box), with individual data points shown as black dots. c Violin plot displays ACKR1 expression distribution across BRCA stages, with interquartile ranges (black bars) and medians (white dots). Statistical analysis (F value and p-value) confirms significant expression differences between stages
Fig. 3
Fig. 3
Correlation Between DARC and Tumor Suppressor Genes in Breast Cancer: The figures show TCGA scatter plots of DARC (ACKR1) correlation with cancer targets in breast cancer: a Significant negative correlation (p = 0.42) between ACKR1 (x-axis, Log2 TPM) and TP53 (y-axis, Log2 TPM). b Moderate negative correlation (R= −0.44, p = 1.3e-56) between ACKR1 (x-axis) and MK167 (y-axis). c Weak but statistically significant negative correlation (R= −0.29, p = 0.03) between ACKR1 (x-axis) and CHEK2 (y-axis)
Fig. 4
Fig. 4
Correlation Between DARC and Tumor Stemness Associated Genes in Breast Cancer: The figures collectively highlight the significant role of ACKR1 (DARC) in breast cancer with ALDH1 (aldehyde dehydrogenase 1) and c-MYC, the proto-oncogene. a There is a statistically significant positive correlation between ACKR1 and ALDH1(R = 0.65). [X-axis: Log2(ACKR1 TPM)—Represents the expression level of ACKR1,Y-axis: Log2(ALDH1 TPM)—Represents the expression level of ALDH1,Scatter points: Show the relationship between ACKR1 and ALDH1 expression levels in individual samples.] b A statistically significant positive correlation was observed between ACKR1 and this target gene c-MYC (R = 0.23). [X-axis: Log2(ACKR1 TPM)—Represents the expression level of ACKR1, Y-axis: Log2(c-MYC TPM)—Represents the expression level of c-MYC, Scatter points: Show the relationship between ACKR1 and c-MYC expression levels in individual samples.]
Fig. 5
Fig. 5
AP-1 site in c-MYC promoter suggests regulation via ACKR1-chemokine signaling. In-silico analysis of the 500 bp upstream promoter region of c-MYC (NM_002467) using ContraV3 revealed a highly conserved AP-1 transcription factor binding site (highlighted in blue), identified at a core stringency of 0.95 and a similarity matrix threshold of 0.85. Given that AP-1 is a downstream effector in the ACKR1-mediated chemokine signaling pathway, this finding suggests potential regulation of MYC expression by CC and CXC chemokines
Fig. 6
Fig. 6
a Immunohistochemistry (IHC) staining results for DARC, CCL8, c-MYC, and ALDH1 in non-TNBC breast cancer patient samples: These markers are known to be involved in various aspects of cancer biology, including tumor growth, metastasis, and chemoresistance. While expression levels vary among patients, there is no clear correlation with clinical or pathological parameters. Chemotherapy may have an impact on the expression of some markers, as seen in Patient 5. Further, Patient 6 despite being classified as recurrent, showed significant expression of c-Myc & ALDH1—the tumor stemness associated markers and low DARC expression compared to pre-treatment levels. This indicates that the recurrence might be directly related to changes in these markers. b Immunohistochemistry (IHC) staining results for DARC, CCL8, c-MYC, and ALDH1 in TNBC breast cancer patient samples: There is no clear correlation between the expression of these markers and clinical staging, pathological staging, or stage group. This suggests that the expression of these markers may be strongly influenced by the overall extent of the tumor or its spread to lymph nodes differing from patient to patient
Fig. 6
Fig. 6
a Immunohistochemistry (IHC) staining results for DARC, CCL8, c-MYC, and ALDH1 in non-TNBC breast cancer patient samples: These markers are known to be involved in various aspects of cancer biology, including tumor growth, metastasis, and chemoresistance. While expression levels vary among patients, there is no clear correlation with clinical or pathological parameters. Chemotherapy may have an impact on the expression of some markers, as seen in Patient 5. Further, Patient 6 despite being classified as recurrent, showed significant expression of c-Myc & ALDH1—the tumor stemness associated markers and low DARC expression compared to pre-treatment levels. This indicates that the recurrence might be directly related to changes in these markers. b Immunohistochemistry (IHC) staining results for DARC, CCL8, c-MYC, and ALDH1 in TNBC breast cancer patient samples: There is no clear correlation between the expression of these markers and clinical staging, pathological staging, or stage group. This suggests that the expression of these markers may be strongly influenced by the overall extent of the tumor or its spread to lymph nodes differing from patient to patient
Fig. 7
Fig. 7
ACKR1 Expression and Survival in Different Breast Cancer Subtypes. The figures suggest ACKR1 expression may predict breast cancer outcomes, with higher expression potentially linked to poorer prognosis, especially in basal-like and HER2-enriched subtypes. a Box plot displays ACKR1 expression (log10 TPM) across breast cancer subtypes (Basal, HER2, Luminal A, Luminal B, TNBC), showing expression variation between subtypes with interquartile ranges, medians, whiskers, and outliers. b Kaplan-Meier survival curve demonstrates significant survival differences among breast cancer subtypes (P = 0.0455, log-rank test), with Luminal A showing best overall survival, followed by HER2-enriched and basal-like subtypes
Fig. 8
Fig. 8
Expression Levels of ACKR1, ACKR3, and ACKR4 in Normal Tissues and Stage III Cancer Tissues: The box plots display the expression levels of ACKR1, ACKR3, and ACKR4 in normal tissues (n = 113) and stage III cancer tissues (n = 248). The y-axis represents the Fragments Per Kilobase of transcript per million mapped reads (FPKM), which indicates gene expression levels
Fig. 9
Fig. 9
Expression Levels of ACKR1 Across Cancer Stages and Associated Survival Analysis: The box plots represent the expression levels of ACKR1 in normal tissues (n = 114) and cancer tissues at different stages: Stage I (n = 183), Stage II (n = 615), Stage III (n = 247), and Stage IV (n = 20). The y-axis shows the transcript per million (TPM) values, indicating gene expression levels
Fig. 10
Fig. 10
Expression of DARC in Breast Carcinoma based on individual cancer stages (based on TCGA data)
Fig. 11
Fig. 11
The figure above provides a network diagram generated by the STRING database, which predicts protein-protein interactions among several proteins. Each node represents a protein, and the lines connecting the nodes represent predicted associations. The proteins in the network include ACKR1, CHEK2, MYC, and ALDH1A1. The connections between these proteins are color-coded to indicate different types of evidence supporting the interactions, such as experimental data, database annotations, and text mining

References

    1. Chaudhuri A, Polyakova J, Zbrzezna V, Williams K, Gulati S, Pogo AO. Cloning of glycoprotein D cDNA, which encodes the major subunit of the Duffy blood group system and the receptor for the Plasmodium vivax malaria parasite. Proc Natl Acad Sci U S A. 1993;90:10793–7. 10.1073/pnas.90.22.10793. - PMC - PubMed
    1. Chaudhuri A, Zbrzezna V, Johnson C, Nichols M, Rubinstein P, Marsh WL, Pogo AO. Purification and characterization of an erythrocyte membrane protein complex carrying Duffy blood group antigenicity. J Biol Chem. 1989;264:13770–4. 10.1016/s0021-9258(18)80067-9. - PubMed
    1. Miller L, Mason S, Dvorak J, McGinniss M, Rothman I. Erythrocyte receptors for (Plasmodium knowlesi) malaria: duffy blood group determinants. Science. 1975;189:561–3. 10.1126/science.1145213. - PubMed
    1. Horuk R, Chitnis C, Darbonne W, Colby T, Rybicki A, Hadley T, Miller L. A receptor for the malarial parasite plasmodium vivax: the erythrocyte chemokine receptor. Science. 1993;261:1182–4. 10.1126/science.7689250. - PubMed
    1. Chaudhuri A, Zbrzezna V, Polyakova J, Pogo AO, Hesselgesser J, Horuk R. Expression of the Duffy antigen in K562 cells: evidence that it is the human erythrocyte chemokine receptor. J Biol Chem. 1994;269:7835–8. 10.1016/s0021-9258(17)37123-5. - PubMed

LinkOut - more resources