. 2025 Aug 25;20(8):e0330287.
doi: 10.1371/journal.pone.0330287. eCollection 2025.

Interaction of coexposure to inorganic arsenic and manganese: Tight junction injury of the blood-brain barrier and the relationship between oxidative stress and inflammatory cytokines in glial cells

Affiliations

Interaction of coexposure to inorganic arsenic and manganese: Tight junction injury of the blood-brain barrier and the relationship between oxidative stress and inflammatory cytokines in glial cells

Toshiaki Hitomi et al. PLoS One. .

Abstract

Coexposure to inorganic arsenic (iAs) and manganese (Mn) may exacerbate cognitive dysfunction caused by iAs alone. In this study, we investigated the cytotoxicity of coexposure to iAs and Mn in glial cells and the expression and correlation between oxidative stress and inflammatory cytokines. Additionally, we assessed tight junction (TJ) injury using a rat in vitro blood-brain barrier (BBB) model. In glial cells, coexposure to iAs and Mn increased cytotoxicity compared to single exposure, suggesting a likely additive effect. iAs exposure significantly increased the expression of antioxidant stress markers, including nuclear factor erythroid 2-related factor 2 (Nrf2) and heme oxygenase-1 (HO-1), relative to Mn exposure. Notably, HO-1 expression was further elevated under coexposure conditions, indicating a potential synergistic effect. Regarding inflammatory cytokines, expression of C-C motif chemokine ligand 2 (MCP-1) and interleukin-6 (IL-6) was slightly higher in the iAs exposure compared to Mn exposure. A synergistic effect was observed in the Mn concentration-dependent increase in IL-6 under coexposure. A significant positive correlation was found between Nrf2 or HO-1 and inflammatory cytokines (MCP-1 and IL-6) (p < 0.001), suggesting an interaction between oxidative stress and inflammatory cytokines. The BBB TJ injury was evaluated by measuring the transendothelial electrical resistance values and the Claudin-5 and zonula occludens-1. The results showed expression in iAs exposure but not in Mn exposure. Furthermore, Mn did not affect iAs-induced TJ injury. In conclusion, our findings demonstrate that coexposure to iAs and Mn exerts synergistic effects on oxidative stress and inflammatory cytokines in glial cells. These joint effects may increase the risk of neurotoxicity compared to single-iAs or Mn exposure.


Conflict of interest statement

The authors declare no conflicts of interest.

Figures
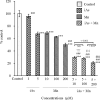
Fig 1
Fig 1. Cytotoxicity of iAs or Mn alone and coexposure to iAs and Mn in glial cells.
The cytotoxicity of iAs (1 and 5 µM) or Mn (10, 100, and 200 µM) alone and coexposure to (iAs + Mn: 5 + 10, 100, and 200 µM) was evaluated in glial cells using the CCK-8 method 24 h after exposure. Results are expressed as mean ± SD (n = 5). Comparisons of the control group, iAs and Mn alone groups, and iAs and Mn coexposure groups were performed using one-way ANOVA with Tukey’s post hoc tests. The levels of statistical significance were as follows: for control, ***p < 0.001; for iAs, ###p < 0.001. Moreover, the significance levels for each concentration of Mn and the corresponding coexposure were as follows: 10 µM, †††p < 0.001; 100 µM, ‡‡‡p < 0.001; 200 µM, $$$p < 0.001. NS indicates no significant differences among the coexposure groups. Detailed statistical values are provided in S1 Table.
Fig 2
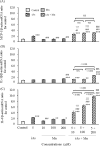
Fig 2. Oxidative stress of iAs or Mn alone and coexposure to iAs and Mn in glial cells.
iAs alone (5 µM) or Mn alone (10, 100, and 200 µM) or coexposure (iAs + Mn: 5 + 10, 100, and 200 µM) treatment of glial cells for 24 h. After exposure, the expression of antioxidant stress-related genes Nrf2 (A) and HO-1 (B) was evaluated by real-time PCR and normalized to β-actin. Data are expressed as Nrf2/β-actin and HO-1/β-actin mRNA ratios. Results are expressed as mean ± SD (n = 4). Comparisons of the control group, iAs and Mn groups, and coexposure to iAs and Mn groups were performed using one-way ANOVA with Tukey’s post hoc tests. The levels of statistical significance were as follows: for control, ***p < 0.001; for iAs, ##p < 0.01, ###p < 0.001. Furthermore, the significance levels for each concentration of Mn and the corresponding coexposures were as follows: 10 µM, †††p < 0.001; 100 µM, ‡‡‡p < 0.001; 200 µM, $$$p < 0.001. Detailed statistical values are provided in S2 Table, corresponding to Figs 2A and 2B.
Fig 3
Fig 3. Inflammatory cytokines in iAs and Mn alone groups and iAs and Mn coexposure groups in glial cells.
iAs alone (5 µM) or Mn alone (10, 100, and 200 µM) or coexposure (iAs + Mn: 5 + 10, 100, and 200 µM) was applied to glial cells for 24 h. mRNA expression levels of the inflammatory cytokines MCP-1 (A), IL-1β(B), and IL-6 (C) were measured by real-time PCR analysis and normalized to β-actin. Data are expressed as MCP-1/β-actin mRNA, IL-1β/β-actin, and IL-6/β-actin ratios. Results are expressed as mean ± SD (n = 4). Comparisons of the control group, iAs and Mn alone groups, and iAs and Mn exposure groups were performed using one-way ANOVA with Tukey’s post hoc tests. The levels of statistical significance were as follows: for control, *p < 0.05, **p < 0.01, ***p < 0.001; for iAs, ##p < 0.01, ###p < 0.001. Moreover, the significance levels for each concentration of Mn and the corresponding coexposures were as follows: 10 µM, †††p < 0.001; 100 µM, ‡‡‡p < 0.001; 200 µM, $$$p < 0.001. NS indicates no significant differences among the coexposure groups. Detailed statistical values are provided in S3 Table, corresponding to Figs 3A–3C.
Fig 4
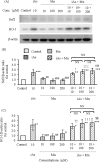
Fig 4. Expression of Nrf2 and HO-1 proteins in the vascular endothelial cell and pericyte groups after exposure to iAs or Mn alone and coexposure to iAs and Mn.
(A): Representative western blot images depicting Nrf2 and HO-1 protein expression after exposure to iAs alone (10 µM), Mn alone (10, 100, and 200 µM), and coexposure (iAs + Mn: 10 + 10, 100, and 200 µM) for 24 h. (B and C): The expression levels of Nrf2 (B) and HO-1 (C) proteins were quantified by densitometry, standardized to β-actin, and compared with the control value of 1. Results are expressed as mean ± SD (n = 4). Comparison of the control group, iAs and Mn alone groups, and iAs and Mn coexposure group was performed using one-way ANOVA with Tukey’s post hoc tests. The levels of statistical significance were as follows: for control, *p < 0.05, **p < 0.01, ***p < 0.001; for iAs, #p < 0.05, ##p < 0.01, ###p < 0.001. The significance levels for each concentration of Mn and the corresponding coexposures were as follows: 10 µM, p < 0.05, ††p < 0.01; 100 µM, ‡‡‡p < 0.001; 200 µM, $$p < 0.01, $$$p < 0.001. NS indicates no significant differences among the coexposure groups. Detailed statistical values are provided in S4 Table, corresponding to Figs 4B and 4C.
Fig 5
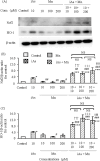
Fig 5. Expression of Nrf2 and HO-1 proteins in astrocytes after exposure to iAs or Mn alone and coexposure to iAs and Mn.
(A): Representative western blot images depicting Nrf2 and HO-1 expression after exposure to iAs alone (10 µM), Mn alone (10, 100, and 200 µM), and coexposure (iAs + Mn: 10 + 10, 100, and 200 µM) for 24 h. (B and C): The expression levels of Nrf2 (B) and HO-1 (C) proteins were quantified by densitometry, standardized to β-actin, and compared with the control value of 1. Results are expressed as mean ± SD (n = 4). Comparison of the control group, iAs and Mn alone groups, and iAs and Mn coexposure group was performed using one-way ANOVA with Tukey’s post hoc tests. The levels of statistical significance were as follows: for control, *p < 0.05, ***p < 0.001; for iAs, #p < 0.05, ##p < 0.01, ###p < 0.001. The significance levels for each concentration of Mn and the corresponding coexposures were as follows: 10 µM, †††p < 0.001; 100 µM, ‡‡‡p < 0.001; 200 µM, $$$p < 0.001. NS indicates no significant differences among the coexposure groups. Detailed statistical values are provided in S5 Table, corresponding to Figs 5B and 5C.
Fig 6
Fig 6. Changes in TEER after exposure to iAs or Mn alone, and coexposure to iAs and Mn.
TEER was measured at 24 h after exposure to iAs alone (10 µM), Mn alone (10, 100, and 200 µM), and coexposure (iAs + Mn: 10 + 10, 100, and 200 µM). The %TEER values were calculated by normalizing each TEER measurement to the mean TEER value of the control group, which was defined as 100%. Results are expressed as mean ± SD (n = 4). Comparison of the control group, iAs and Mn alone groups, and iAs and Mn coexposure groups was performed using one-way ANOVA with Tukey’s post hoc tests. The levels of statistical significance were as follows: for control, ***p < 0.001; for iAs, ###p < 0.001. The significance levels for each concentration of Mn and the corresponding coexposures were as follows: 10 µM, †††p < 0.001; 100 µM, ‡‡‡p < 0.001; 200 µM, $$$p < 0.001. NS indicates no significant differences among the coexposure groups. Detailed statistical values are provided in S6 Table, corresponding to Fig 6.
Fig 7
Fig 7. Expression of the tight junction proteins claudin-5 and ZO-1 after exposure to iAs or Mn alone and coexposure to iAs and Mn.
(A): Claudin-5 and ZO-1 expressions were measured by WB analysis after 24 h of exposure to iAs alone (10 µM) or Mn alone (10, 100, 200 µM) or iAs and Mn coexposure (iAs + Mn: 10 + 10, 100, and 200 µM). (B and C): Expression levels of claudin-5 (B) and ZO-1 (C) were quantified by densitometry, standardized to β-actin, and compared with the control value of 1. Results are expressed as mean ± SD (n = 4). Comparison of the control group, iAs and Mn alone groups, and iAs and Mn coexposure groups was performed using one-way ANOVA with Tukey’s post hoc tests. The levels of statistical significance were as follows: for control, *p < 0.05, **p < 0.01, ***p < 0.001; for iAs, #p < 0.05, ##p < 0.01. The significance levels for each concentration of Mn and the corresponding coexposures were as follows: 10 µM, ††p < 0.01, †††p < 0.001; 100 µM, p < 0.05, ‡‡p < 0.01; 200 µM, $p < 0.05. NS indicates no significant differences among the coexposure groups. Detailed statistical values are provided in S7 Table, corresponding to Figs 7B and 7C.
Fig 8
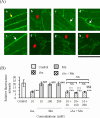
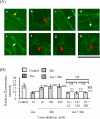
Fig 8. Altered localization and expression of the tight junction protein claudin-5 by iAs or Mn alone and coexposure to iAs and Mn.
(A): Representative immunofluorescence staining of claudin-5 (green, Alexa Fluor 488) after 24h exposure: a, control; b, iAs (10 µM); c-e, Mn groups (10, 100, and 200 µM); f-h, iAs and Mn coexposure groups (iAs + Mn: 10 + 10, 100, and 200 µM). The yellow arrow indicates typical TJ protein localization in the control group. Red arrowheads indicate altered TJ protein localization due to iAs-induced damage. White arrows indicate typical TJ protein localization after Mn exposure. Scale bars: 20 µm. (B): Quantitative analysis of the immunofluorescence staining of claudin-5. Relative fluorescence intensity of claudin-5 is expressed as mean ± SD (n = 6). Comparison of the control group, iAs and Mn alone groups, and iAs and Mn coexposure groups was performed using one-way ANOVA with Tukey’s post hoc tests. The levels of statistical significance were as follows: for control, ***p < 0.001; for iAs, ###p < 0.001. The significance levels for each concentration of Mn and the corresponding coexposures were as follows: 10 µM, †††p < 0.001; 100 µM, ‡‡‡p < 0.001; 200 µM, $$$p < 0.001. NS indicates no significant differences among the coexposure groups. Detailed statistical values are provided in S8 Table, corresponding to Fig 8B.
Fig 9
Fig 9. Altered localization and expression of the tight junction protein ZO-1 by iAs or Mn alone and coexposure iAs and Mn.
(A): Representative immunofluorescence staining of ZO-1 (green, Alexa Fluor 488) after 24h exposure: a, control; b, iAs (10 µM); c-e, Mn groups (10, 100, and 200 µM); f-h, iAs and Mn coexposure groups (iAs + Mn: 10 + 10, 100, and 200 µM). The yellow arrow indicates typical TJ protein localization in the control group. Red arrowheads indicate altered TJ protein localization due to iAs-induced damage. White arrows indicate typical TJ protein localization after Mn exposure. Scale bars: 20 µm. (B): Quantitative analysis of the immunofluorescence staining of ZO-1. Relative fluorescence intensity of ZO-1 is expressed as mean ± SD (n = 6). Comparison of the control group, iAs and Mn alone groups, and iAs and Mn coexposure groups was performed using one-way ANOVA with Tukey’s post hoc tests. The levels of statistical significance were as follows: for control, ***p < 0.001; for iAs, ###p < 0.001. The significance levels for each concentration of Mn and the corresponding coexposures were as follows: 10 µM, †††p < 0.001; 100 µM, ‡‡‡p < 0.001; 200 µM, $$$p < 0.001. NS indicates no significant differences among the coexposure groups. Detailed statistical values are provided in S9 Table, corresponding to Fig 9B.

Similar articles

References

    1. Wasserman GA, Liu X, Parvez F, Ahsan H, Factor-Litvak P, van Geen A, et al. Water arsenic exposure and children’s intellectual function in Araihazar, Bangladesh. Environ Health Perspect. 2004;112(13):1329–33. doi: 10.1289/ehp.6964 - DOI - PMC - PubMed
    1. Wasserman GA, Liu X, Parvez F, Ahsan H, Factor-Litvak P, Kline J, et al. Water arsenic exposure and intellectual function in 6-year-old children in Araihazar, Bangladesh. Environ Health Perspect. 2007;115(2):285–9. doi: 10.1289/ehp.9501 - DOI - PMC - PubMed
    1. Hamadani JD, Tofail F, Nermell B, Gardner R, Shiraji S, Bottai M, et al. Critical windows of exposure for arsenic-associated impairment of cognitive function in pre-school girls and boys: a population-based cohort study. Int J Epidemiol. 2011;40(6):1593–604. doi: 10.1093/ije/dyr176 - DOI - PubMed
    1. Wasserman GA, Liu X, Parvez F, Chen Y, Factor-Litvak P, LoIacono NJ, et al. A cross-sectional study of water arsenic exposure and intellectual function in adolescence in Araihazar, Bangladesh. Environment International. 2018;118:304–13. doi: 10.1016/j.envint.2018.05.037 - DOI - PMC - PubMed
    1. Manju R, Hegde AM, Parlees P, Keshan A. Environmental Arsenic Contamination and Its Effect on Intelligence Quotient of School Children in a Historic Gold Mining Area Hutti, North Karnataka, India: A Pilot Study. J Neurosci Rural Pract. 2017;8(3):364–7. doi: 10.4103/jnrp.jnrp_501_16 - DOI - PMC - PubMed