. 2025 Aug 25;9(9):vlaf033.
doi: 10.1093/immhor/vlaf033.

Identification of conserved T cell epitopes and flanking amino acid mutants of endogenous retrovirus Gag antigen in nonobese diabetic mice

Affiliations

Identification of conserved T cell epitopes and flanking amino acid mutants of endogenous retrovirus Gag antigen in nonobese diabetic mice

Yang D Dai et al. Immunohorizons. .

Abstract

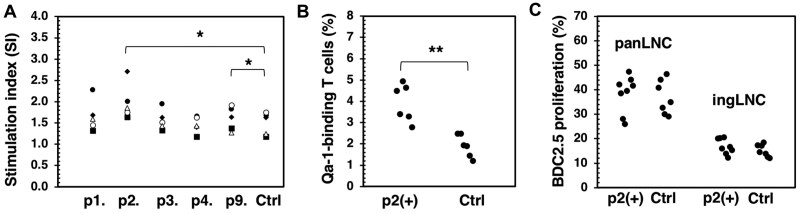
The interactions between endogenous retroviruses (ERVs) and major histocompatibility complex molecules may significantly influence autoimmune diseases due to their common roles in the evolution and development of the adaptive immune system. Notably, regions within the Gag antigens of a specific group of ERVs, similar to murine leukemia retroviruses, exhibit patterns of sequence conservation, variation, and mutation. One highly conserved peptide of Gag, p5-13 (VTTPLSLTL), binds with high affinity to a nonclassic major histocompatibility complex molecule, Qa-1, and is preferentially recognized by T cells enriched in the pancreas of nonobese diabetic (NOD) mice, which spontaneously develop autoimmune type 1 diabetes. Interestingly, deep sequencing analysis of the Gag genes expressed in NOD mice has revealed numerous mutations flanking the conserved Qa-1-binding sequences. This includes 1 epitope, p310-328, which contains both conserved and mutated residues that can elicit autoreactive T cells in NOD mice. A specific residue, D316, within this epitope accumulates multiple mutations as the disease progresses, leading to a reduction in the consensus score in sequence alignment at this position during the later stages of prediabetes. Consistently, the substitution of the D316 residue with a dominant mutant, G316, enhances the antigenicity of this epitope, stimulating autoreactive T cells in prediabetic NOD mice to release interferon-γ . Thus, sequence variants of ERV Gag antigens encode overlapping conserved and highly mutated epitopes that can be recognized by T cells and utilized for biomarker discovery.

Keywords: Gag; MHC; Qa-1; endogenous retrovirus; epitope.


Conflict of interest statement

W-Y.H. is the founder of Biosettia, Inc. and owns the licencing rights for the Gag-specific mAbs produced for this study.

Figures

Figure 1.
Figure 1.
Expression of Qa-1 and Gag antigens in prediabetic NOD mice. (A) Qa-1 expression in the islets of 6-wk-old (n = 9) and 11-wk-old (n = 13) female NOD mice was quantified using real-time polymerase chain reaction and is presented as ΔCT (delta threshold cycles). Smaller ΔCT values indicate higher expression levels. ΔCT = CT.H2-T23(Qa-1) – CT.Rpl19(housekeeping). Each dot represents an individual mouse. Data were pooled from 2 independent experiments. (B) Approximately 300 islets collected from NOD or NOD.scid female mice (3–4 mice per group) were assessed for Gag protein expression through Western blot analysis utilizing a polyclonal anti-Gag goat serum for Gag detection. The insulinoma cell line Min6 was used as a positive control. (C) Detection of Gag antigen in serum samples. Serum from 6- or 11-wk-old female NOD mice or control B6 mice was diluted (1:10) in a sandwich ELISA using a pair of Gag-specific monoclonal antibodies, clones 9-27-45 and 16-59-87, for detection. Each dot represents an individual mouse. Similar results were obtained across three experiments. *P < 0.05; **P < 0.01. OD, optical density.
Figure 2.
Figure 2.
Regulating T cell responses by Qa-1–restricted Gag peptides. (A) Splenocytes were stimulated with anti-CD3/28 (1.0 µg/mL of each) in the presence or absence (control [Ctrl]) of Gag peptides shown (10 µg/mL) for 48 h. IFN-γ release in the supernatants was measured using a cytokine bead assay. Stimulation indexes were calculated as follows: IFN-γ in the presence of peptide/IFN-γ from anti-CD3/28 alone. (B) NOD female mice (6–8 wk old) were injected intraperitoneally with p2 peptides (10 µg/mouse) twice within 1 wk. Ctrl mice were age/sex matched, untreated mice. Qa-1–binding T cells in the spleens of the treated or Ctrl mice were subsequently measured. A recombinant IgFc-Qa-1 protein was used to stain Qa-1–binding T cells, with the percentage within the CD4+ population shown. Each dot represents an individual mouse. (C) CFSE-labeled BDC2.5 cells, obtained from transgenic mice, were transferred into the NOD mice treated as described in panel B. After 5 d, proliferating CFSE-low BDC2.5 T cells were quantified in the pancreatic or inguinal lymph nodes. Each dot represents 1 recipient mouse. *P < 0.05; **P < 0.01. ingLNC, inguinal lymph node cell; panLNC, pancreatic lymph node cell.
Figure 3.
Figure 3.
Detection of Qa-1–binding T cells recognizing Gag peptides. Gag-specific, Qa-1–binding T cells were detected using a mixture of recombinant IgFc-Qa-1 and β2m proteins (IgFc-Qa-1/β2m) in the presence or absence of Gag peptides. (A) Background staining of NOD pancreatic lymph node (pLN) cells with IgFc-Qa-1/β2m. Only B220-negative cells were analyzed. (B) Lymph node cells from NOD mice of different ages and breeding colonies were stained with IgFc-Qa-1/β2m along with various Gag peptides. Peptide-specific, Qa-1–binding CD4+ T cells were calculated as the percentage of IgFc-Qa-1/β2m/peptide–binding cells minus the percentage of the no-peptide control (IgFc-Qa-1 and β2m only). (C) Singel cells of pLNs or inguinal lymph nodes (iLNs) from NOD females (6, 11, and 16 wk old) and NOD male mice (8–10 wk old), purchased from the Jackson Laboratory, were stained with IgFc-Qa-1/β2m and Gag peptide p#2 (VTTPLSLTL) or the control Qdm peptide (AMAPRTLLL). A t test analysis was used to compare between groups as marked. *P < 0.05; **P < 0.01.
Figure 4.
Figure 4.
Identification of conserved and nonconserved Qa-1–Restricted gag peptides. An ERV Gag gene (GenBank ID: DQ366147) was utilized to search the mouse genome (GRCm38/mm10) for homologous sequences using the online BLAT genome search program (http://genome.ucsc.edu/cgi-bin/hgBlat). Only sequences encoding a complete ORF of Gag-like genes were selected. A total of 48 distinct ORFs were translated into amino acid sequences and used for alignment analysis. The p2 (A) and p9 (B) regions, extended at both the N- and C-termini, were examined to identify conserved and nonconserved amino acid residues among the 48 sequences. Predicted Qa-1–binding sequences are underlined, and nonconserved residues are in bold. An amino acid logo is plotted using the indicated consensus scores of the most abundant amino acid for each position.
Figure 5.
Figure 5.
Deep sequencing analysis of Gag gene variants and ORFs in NOD Mice. Islet RNA samples were examined using targeted deep sequencing analysis to identify sequence variants and ORFs of Gag genes. (A) The p2 region is targeted using an amplicon (nt-95-376) for deep sequencing. ORFs were translated to protein sequences for alignment analysis using Jalview software to calculate consensus scores for individual amino acids at each position. Only positions 1 to 20 are shown, including the p2 sequence p5-13 (VTTPLSLTL). Scores for each consensus amino acid and their variants are listed under each position. (B) Eight NOD female mice at 6 wk of age were included to account for experimental variations. (C, D) The p9 region is targeted using an amplicon (nt838-1197) for deep sequencing and amino acid alignment analysis. Similarly, 8 islet samples from individual NOD females (6 wk old) were analyzed.
Figure 6.
Figure 6.
Evaluating Gag variants in autoimmune responses and T1D development. (A, B) Consensus levels of specific amino acid residues can serve as disease biomarkers for monitoring autoimmune progression. Pancreatic islets (A) and sera (B, C) from NOD female mice of different ages (n = 8 per age group) were analyzed using the amplicon nt838-1197. (B) Average consensus scores at positions D316 and R325 of the p9 region are shown. (C) Consensus scores for G316 of individual mice at different age groups (n = 8 per group) are shown. A t test was performed to compare different age groups. (D) NOD female splenocytes (8–10 wk old) were stimulated in vitro using synthetic peptides (10 µg/mL) p310 to p328, which either contain D316 or G316. IFN-γ release in the supernatants was measured in a cytokine bead assay, and stimulation indexes were calculated as follows: IFN-γ with peptide/IFN-γ of medium control. Each dot represents a single mouse. *P < 0.05; **P < 0.01.

Similar articles

References

    1. Chesebro B, Miyazawa M, Britt WJ. Host genetic control of spontaneous and induced immunity to Friend murine retrovirus infection. Annu Rev Immunol. 1990;8:477–499. - PubMed
    1. McDevitt HO. Discovering the role of the major histocompatibility complex in the immune response. Annu Rev Immunol. 2000;18:1–17. - PubMed
    1. Tomonaga K, Coffin JM. Structure and distribution of endogenous nonecotropic murine leukemia viruses in wild mice. J Virol. 1998;72:8289–8300. - PMC - PubMed
    1. Evans LH et al. Mobilization of endogenous retroviruses in mice after infection with an exogenous retrovirus. J Virol. 2009;83:2429–2435. - PMC - PubMed
    1. Kassiotis G, Stoye JP. Immune responses to endogenous retroelements: taking the bad with the good. Nat Rev Immunol. 2016;16:207–219. - PubMed

MeSH terms

Substances