. 2025 Aug 26;10(1):271.
doi: 10.1038/s41392-025-02359-9.

High fructose consumption aggravates inflammation by promoting effector T cell generation via inducing metabolic reprogramming

Affiliations

High fructose consumption aggravates inflammation by promoting effector T cell generation via inducing metabolic reprogramming

Xiao Ma et al. Signal Transduct Target Ther. .

Abstract

The intake of sugars, especially glucose and fructose, has significantly increased with the change of lifestyle. Excessive intake of sugar has been proven to be associated with tumors and inflammatory diseases. Fructose directly mediates innate immune responses; however, whether it can directly regulate T-cell immunity remains unknown. We show that high fructose consumption accelerates the development of inflammatory bowel disease (IBD) by promoting the generation of T helper 1 (Th1) and T helper 17 (Th17) cells. It was demonstrated that fructose promotes the differentiation of Th1 and Th17 cells directly by enhancing mechanistic target of rapamycin complex 1 (mTORC1) activation through the glutamine metabolism-dependent pathway. Reactive oxygen species (ROS)-induced activation of transforming growth factor-β (TGF-β) is also involved in fructose-induced Th17 cell generation. Moreover, metformin can reverse Th1 and Th17 cell generation induced by fructose by suppressing mTORC1 activation and reducing ROS-mediated TGF-β activation. Finally, we identified metformin as an in vivo therapeutic drug for relieving high fructose consumption-induced T-cell inflammation and colitis aggravation. Our study revealed a previously unknown adverse effect of high fructose consumption in disrupting immune homeostasis and exacerbating IBD by directly promoting T-cell immunity, and showed metformin is a potential therapeutic for reversing the T cell immune imbalance caused by long-term high fructose consumption.


Conflict of interest statement

Competing interests: The authors declare no competing interests.

Figures
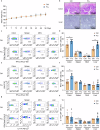
Fig. 1
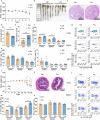
Fig. 1
High fructose consumption promotes Th1 and Th17 cell-mediated immunity. T cell immune responses in C57BL/6 mice treated with 20% fructose water for 2 months were investigated (n = 5). One of two independent experiments was showed. a Body weight changes in control- (Ctrl) and fructose (Fru)-treated mice. b H&E-stained colon and liver sections. (c–h) Frequencies of IFN-γ+CD4+ T (Th1) (c, d), IFN-γ+CD8+ T (Tc1) (e, f), and IL-17A+CD4+ T (Th17) (g, h) cells in indicated tissues. Unpaired two-tailed Student’s t-tests were used to calculate statistical significance. Data are presented as mean ± SD. *p < 0.05; **p < 0.01
Fig. 2
Fig. 2
High fructose consumption exacerbates inflammatory bowel disease by enhancing Th1 and Th17 cell-mediated immunity in two disease models. a–i The DSS-induced colitis model (n = 5). One of two independent experiments was showed. a Changes in body weight during the colitis induction. b The photograph of the colons. c H&E-stained colon sections. d The length of the colon. e The inflammation score of colitis (n = 10, pooled from two independent experiments). f–i Frequencies of Th1 (f, g), Tc1 (h), and Th17 (i) cells in indicated tissues. j–n The T cell transfer colitis model (n = 4). One of two independent experiments was showed. j Changes in body weight during colitis development. k H&E-stained colon sections. Frequencies of Th17 cells (l, m) and Th1 cells (n) in the colon, spleen, and MLN. Unpaired two-tailed Student’s t tests were used to calculate statistical significance. Data are presented as mean ± SD. *p < 0.05; **p < 0.01; ****p < 0.0001
Fig. 3
Fig. 3
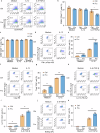
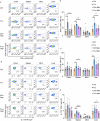
Fructose directly promotes differentiation of Th1 and Th17 cells in vitro. Naïve T cells were cultured in cDMEM containing 25 mM glucose or 25 mM fructose in the presence of indicated cytokines (n = 3). Th1 cells were induced with recombinant mouse IL-12 (10 ng/mL), and Th17 cells were induced with recombinant human TGF-β1 (2 ng/mL) and recombinant mouse IL-6 (50 ng/mL). Cells were cultured at 37 °C, 5% CO2 for 3 days. a–c The RNA level of Ifng (a) and Th1 cell frequencies (b, c) under indicated cell culture conditions. d–f The RNA level of Tbx21 (d) and T-bet+CD4+ T cell frequencies (e, f) under indicated cell culture conditions. g–i The RNA level of Il17a (g) and Th17 cell frequencies (h, i) under indicated cell culture conditions. j–l The RNA level of Rorc (j) and RORγt+CD4+ T cell frequencies (k, l) under indicated cell culture conditions. Unpaired two-tailed Student’s t tests were used to calculate statistical significance. Summary data are presented as mean ± SD. *p < 0.05; **p < 0.01; ***p < 0.001; ****p < 0.0001
Fig. 4
Fig. 4
Th1 and Th17 cell differentiation promoted by fructose is not through the regulation of T-cell activation. ac Naïve T cells were cultured in cDMEM containing 25 mM glucose or 25 mM fructose in the presence of indicated cytokines for 24 h (n = 3). Frequencies of CD62L+CD44low inactivated T cells (a, b) and CD69+CD25+ activated T cells (c) in T cells cultured in Th0, Th1, and Th17 cell induction conditions. dk Naïve T cells were cultured in a normal cDMEM for 24 h. TCR stimulation was then removed, and T cells were re-cultured in cDMEM containing 25 mM glucose or 25 mM fructose in the presence of IL-2 (10 ng/mL), with or without IL-12 (for Th1 cell induction) or TGF-β1 plus IL-6 (for Th17 cell induction), for 2 days (n = 3). d, e Th1 cell frequencies under indicated cell culture conditions. f, g T-bet+CD4+ T cell frequencies under indicated cell culture conditions. h, i Th17 cell frequencies under indicated cell culture conditions. j, k RORγt+CD4+ T cell frequencies under indicated cell culture conditions. Unpaired two-tailed Student’s t tests were used to calculate statistical significance. Data are presented as mean ± SD. *p < 0.05; **p < 0.01; ***p < 0.001
Fig. 5
Fig. 5
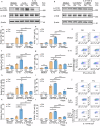
Fructose promotes Th1 and Th17 cell differentiations through a glutamine metabolism-dependent pathway. a, b The ECAR and OCR of CD4+ T cells incubated in glucose or fructose medium for 24 h were determined (n = 3). c Analysis of the significantly different metabolites in T cells cultured in cDMEM containing fructose or glucose for 3 days (the horizontal coordinate in the Figure represents the log2 FC value of the differential metabolites, and the vertical coordinate represents the significantly different metabolites. Red shows upregulated differential metabolites in fructose-treated T cells, and blue shows downregulated differential metabolites in fructose-treated T cells. dk Naïve T cells were cultured in cDMEM containing 25 mM glucose or fructose, with or without indicated cytokines and reagents. Glutamine metabolism pathway was blocked with a glutaminase inhibitor CB839 (1 μM) or by Gls gene mutation using CRISPR/CAS9 system. Cells were cultured at 37 °C, 5% CO2 for 3 days (n = 3). Frequencies of IFN-γ+ CD4+ Th1 cells (d), T-bet+ CD4+ T cells (e), IL-17A+ CD4+ Th17 cells (f), and RORγt+ CD4+ T cells (g) under indicated cell culture conditions. Frequencies of IFN-γ+ CD4+ Th1 cells (h), T-bet+ CD4+ T cells (i), IL-17A+ CD4+ Th17 cells (j), and RORγt+ CD4+ T cells (k) in control T cells or Gls mutant T cells under indicated cell culture conditions. Unpaired two-tailed Student’s t tests were used to calculate statistical significance. Data are presented as mean ± SD. *p < 0.05; **p < 0.01; ***p < 0.001; ****p < 0.0001
Fig. 6
Fig. 6
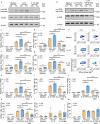
Fructose promotes differentiation of Th1 and Th17 cells via glutamine metabolism-dependent mTORC1 activation. Naïve T cells were cultured in glucose medium or fructose medium for 24 h or 3 days, with or without indicated cytokines and reagents (n = 3). a, b Western blot analysis of mTOR and phospho-mTOR (Ser2448) in T cells post 24 h culture. c–e The RNA level of Ifng (c) and frequencies of Th1 cells (d, e) in T cells post 3 days culture. f, g The RNA level of Tbx21 (f) and frequencies of T-bet+CD4+ T cells (g) in T cells post 3 days culture. h–j The RNA level of Il17a (h) and frequencies of Th17 cells (i, j) in T cells post 3 days culture. k, l The RNA level of Rorc (k) and frequencies of RORγt+CD4+ T cells (l) in T cells post 3 days culture. Unpaired two-tailed Student’s t tests were used to calculate statistical significance. Data are presented as mean ± SD. *p < 0.05; **p < 0.01; ***p < 0.001; ****p < 0.0001
Fig. 7
Fig. 7
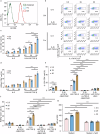
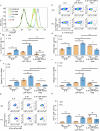
High fructose-induced TGF-β activation is involved in fructose-induced Th17 cell differentiation. a Naïve T cells were cultured in glucose medium or fructose medium for 24 h, then the production of ROS was determined (n = 3). bd Naïve T cells were cultured in cDMEM containing indicated concentrations of glucose or fructose for 3 days (n = 3). b, c Frequencies of Th17 cells in T cells post 3 days culture. d Frequencies of RORγt+CD4+ T cells in T cells post 3 days culture under indicated cell culture conditions. Naïve T cells were cultured in glucose medium or fructose medium for 3 days, with or without indicated cytokines and reagents (n = 3). e, f Frequencies of Th17 cells (e) and RORγt+CD4+ T cells (f) in T cells cultured under indicated cell culture conditions. g Naïve T cells were cultured in indicated media for 24 h, then the production of ROS was determined (n = 3). Unpaired two-tailed Student’s t tests were used to calculate statistical significance. Data are presented as mean ± SD. *p < 0.05; **p < 0.01; ***p < 0.001; ****p < 0.0001
Fig. 8
Fig. 8
Metformin inhibits fructose-induced Th1 and Th17 cell differentiations by suppressing mTORC1. Naïve T cells were cultured in glucose medium or fructose medium for 24 h or 3 days, with or without indicated cytokines and reagents (n = 3). a, b Western blot analysis of mTOR and phospho-mTOR (Ser2448) in T cells post 24 h culture. c–e The RNA level of Ifng (c) and frequencies of IFN-γ+CD4+ Th1 cells (d, e) in T cells post 3 days culture. f, g The RNA level of Tbx21 (f) and frequencies of T-bet+CD4+ T cells (g) in T cells post 3 days culture. h, i The RNA level of Il17a (h) and frequencies of Th17 cells (i) in T cells post 3 days culture. j, k The RNA level of Rorc (j) and frequencies of RORγt+CD4+ T cells (k) in T cells post 3 days culture. l, m Frequencies of Foxp3+CD4+ Treg cells in T cells post 3 days culture. Unpaired two-tailed Student’s t-tests were used to calculate statistical significance. Data are presented as mean ± SD. *p < 0.05; **p < 0.01; ***p < 0.001; and ****p < 0.0001
Fig. 9
Fig. 9
Metformin inhibits fructose-induced TGF-β activation by suppressing ROS production. a Naïve T cells were cultured in glucose medium or fructose medium for 24 h, then the production of ROS was determined (n = 3). bh Naïve T cells were cultured in glucose medium or fructose medium for 3 days under indicated cell culture conditions (n = 3). Frequencies of IL-17A+CD4+ Th17 cells (b, c) and RORγt+CD4+ T cells (d) in T cells post 3 days culture. The RNA levels of Il17a (e) and Rorc (f) in T cells post 3 days culture. g, h Frequencies of IFN-γ+CD4+ Th1 cells in T cells post 3 days culture under indicated cell culture conditions. Unpaired two-tailed Student’s t tests were used to calculate statistical significance. Data are presented as mean ± SD. *p < 0.05; **p < 0.01; ***p < 0.001; ****p < 0.0001
Fig. 10
Fig. 10
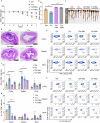
Metformin supplementation inhibits high fructose consumption-induced T cell inflammation in vivo. C57BL/6 mice were treated with control or high fructose water for 8 weeks, and half of these mice were treated with metformin (2.5 mg/mL) during the 5th to 8th weeks (n = 5). One of two independent experiments was showed. a, b Frequencies of IFN-γ+CD4+ Th1 cells in indicated tissues of the mice. c Frequencies of IFN-γ+CD8+ Tc1 cells in indicated tissues of the mice. d, e Frequencies of IL-17A+CD4+ Th17 cells in indicated tissues of the mice. One-way ANOVA (with Tukey’s multiple-comparisons post-tests) was used to calculate statistical significance. Data are presented as mean ± SD. *p < 0.05; **p < 0.01; ***p < 0.001
Fig. 11
Fig. 11
Metformin supplementation suppresses high fructose intake-induced colitis aggravation. C57BL/6 mice were treated with control or high fructose water for 8 weeks, and half of these mice were treated with metformin (2.5 mg/mL) during the 5th to 8th weeks. Then, the DSS-induced colitis model was established to investigate the disease development after fructose water treatment (n = 4). One of two independent experiments was shown. a Changes in body weight during the colitis induction. b, c The length and photograph of the colons. d H&E-stained colon sections. e, f Frequencies of IFN-γ+CD4+ Th1 cells in indicated tissues of the mice. g, h Frequencies of IL-17A+CD4+ Th17 cells in indicated tissues of the mice. One-way ANOVA (with Tukey’s multiple-comparisons post-tests) was used to calculate statistical significance. Summary data are presented as mean ± SD. *p < 0.05; **p < 0.01; ***p < 0.001; ****p < 0.0001

References

    1. Malik, V. S. & Hu, F. B. Fructose and cardiometabolic health what the evidence from sugar-sweetened beverages tells us. J. Am. Coll. Cardiol.66, 1615–1624 (2015). - PMC - PubMed
    1. Taylor, S. R. et al. Dietary fructose improves intestinal cell survival and nutrient absorption. Nature597, 263–267 (2021). - PMC - PubMed
    1. Rodriguez, L. A., Madsen, K. A., Cotterman, C. & Lustig, R. H. Added sugar intake and metabolic syndrome in US adolescents: cross-sectional analysis of the National Health and Nutrition Examination Survey 2005-2012. Public Health Nutr.19, 2424–2434 (2016). - PMC - PubMed
    1. Jensen, T. et al. Fructose and sugar: a major mediator of non-alcoholic fatty liver disease. J. Hepatol.68, 1063–1075 (2018). - PMC - PubMed
    1. Herman, M. A. & Samuel, V. T. The sweet path to metabolic demise: fructose and lipid synthesis. Trends Endocrinol. Metab.27, 719–730 (2016). - PMC - PubMed

MeSH terms

LinkOut - more resources