. 2025 Aug 26;11(1):71.
doi: 10.1038/s41421-025-00822-z.

Targeting miR-337 mitigates disuse-induced bone loss

Affiliations

Targeting miR-337 mitigates disuse-induced bone loss

Jiao Li et al. Cell Discov. .

Abstract

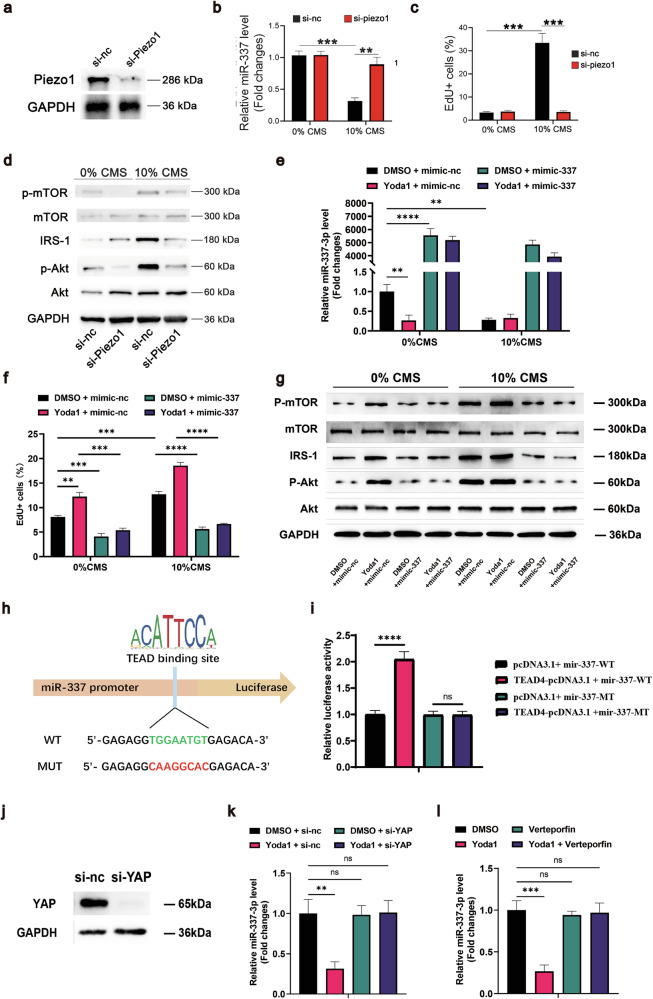
Disuse-induced bone loss occurs in long-term bed-ridden patients and in astronauts during spaceflight. The underlying mechanisms are poorly understood. In a rodent model of disuse-induced bone loss (called hindlimb unloading (HU)), we observed that decreased numbers of leptin receptor (LepR) positive mesenchymal stem cells (MSCs) in adult bone marrow, contribute to bone loss. MicroRNA-337-3p (miR-337) was upregulated in MSCs upon HU and inhibited MSC proliferation by directly targeting IRS-1 to suppress the PI3kinase-Akt-mTOR pathway. Piezo1 was the upstream receptor for sensing mechanical stress and regulated miR-337 through the Hippo-YAP signaling pathway. Remarkably, the knockout of miR-337 significantly attenuated HU-induced, but not ovariectomy-induced, bone loss by increasing MSC proliferation and osteogenesis. Finally, the transplantation of miR-337-/- MSCs into wild-type HU mice was sufficient to mitigate bone loss. These findings reveal the cellular and molecular mechanisms underlying disuse-induced bone loss and highlight a feasible therapeutic strategy to prevent disuse- or microgravity-induced bone loss on Earth and during spaceflight.


Conflict of interest statement

Conflict of interest: The authors declare no competing interests.

Figures

Fig. 1
Fig. 1. The MSC frequency was markedly reduced in BM of HU rats.
a Schematic of HU models and WB controls. Representative micro-CT images (b) and quantification of three-dimensional microstructural parameters (c) of femurs from HU rats and WB controls. d Relative serum Ocn and CTX1 levels in WB and HU rats. The data are presented as the fold changes relative to those of the WB samples. e Representative images of tibia sections from rats subjected to HU for 7 days and stained with LepR. f Quantification of LepR+ cells. The data are presented as percentages of positively stained cells to total cells (DAPI-stained nuclei) *P < 0.05, **P < 0.01, and ***P < 0.001 compared with WB (one-way ANOVA with Dunnett’s post hoc test), n = 6 per group. The data are presented as the means ± SEM. g Flow cytometry analysis showing the percentage of CD45/CD31LepR+ cells in the BM of WB rats and rats suspended for 7 days. The data are presented as the means ± SD, n = 6 per group, and are representative of three independent experiments. h Representative image of CFU clones formed by the BM cells derived from rats subjected to unloading for 7 days. The number of clones larger than 40 cells was calculated.
Fig. 2
Fig. 2. The number of proliferating LepR+ cells was decreased in the BM of unloaded rats.
a Representative images of mIHC of tibia sections from WB controls and rats suspended for 7 days. Scale bars, (upper panel) 600 μm; (lower panel) 50 μm. b Schematic of the LepR+ cell niches. c Quantification of the 4 subsets of LepR+ cells in the 3 niches (< 50 μm), n = 6 per group.
Fig. 3
Fig. 3. CMS-activated quiescent MSCs by the miR-337-PI3K-Akt-mTOR pathway.
Flow cytometry analysis showing the percentage of EdU+ MSCs treated with the indicated CMS elongations (a) or 10% CMS (b) for the indicated time after serum-starvation for 8 h. c Schematic of the different MSC treatments groups used for the RNA-seq analysis. d Flow cytometry analysis of the percentage of EdU+ MSCs starved for 12 h and then stimulated with 10% CMS for another 24 h and treated with DMSO, LY294002, or rapamycin. Antagonistic agents were added at the time of the CMS treatment. The baseline (black dotted line) indicates the percentage of EdU+ MSCs before CMS treatment. e Rapamycin administration decreased the bone volume of WB rats as indicated by the micro-CT analysis of tibia sections from rats treated for 28 days. f Quantification of three-dimensional microstructural parameters from micro-CT images. g Heatmap of differentially expressed miRNAs that specifically target the PI3K-Akt pathway in MSCs treated with 10% CMS or FBS for 24 h after 8 h of serum starvation. h Quantitative RT-PCR was used to measure the expression of miR-337 in de novo isolated LepR+ cells from rats suspended for 7 days as well as WB controls. i Representative Western blot images showing the activation of the PI3K-Akt-mTOR pathways. The cells were transfected with the miR-337 mimic or inhibitor before they were subjected to 10% CMS-stimulated proliferation. j Quantification of the relative protein levels was normalized to the intensity of GAPDH in 3 independent experiments. k Flow cytometry analysis showing the percentage of EdU+ cells after being transfection with the miR-337 mimic or inhibitor, followed by 10% CMS stimulation for 24 h. l Representative images of CFU-F and ALP staining. MSCs were transfected with the miR-337 mimic or inhibitor as indicated for 24 h before the CFU-F and osteogenic assays were performed. m Quantification of CFU and ALP staining intensities shown in (l). n Flow cytometry analysis revealed that the fluorescent intensity of the GFP-IRS1 reporter was regulated by miR-337. o Schematic of the in vivo reporter assay. p Flow cytometry analysis showing the fluorescence intensity of GFP in CD45/CD31/LepR+ cells in rats suspended for 7 days after an intramedullary injection of the AAV-GFP-IRS1 reporter. Statistical significance was assessed by Student’s t-test of the results from 3 independent experiments. n = 3 per group. *P < 0.05, **P < 0.01, ***P < 0.001. The data are presented as means ± SD. The miR-337 expression levels were normalized to those of U6.
Fig. 4
Fig. 4. miR-337 regulates the PI3K-Akt signaling pathway through IRS-1.
a Flow cytometry analysis showing the percentage of EdU+ rMSCs after transfection with the miR-337 inhibitor or IRS-1 si-RNA as indicated, followed by treatment with 0% CMS or 10% CMS for 24 h after 8 h of serum starvation. b Representative Western blot images showing the activation of the PI3K-Akt-mTOR pathway. rMSCs were transfected with the miR-337 inhibitor or IRS-1 si-RNA as indicated before they were subjected to 0% CMS or 10% CMS for 24 h after 8 h of serum starvation. c Flow cytometry analysis showing the percentage of EdU+ rMSCs after infection with LV-nc or LV-IRS-1 and subsequent transfection with the miR-337 mimic as indicated, followed by 10% CMS stimulation for 24 h after 8 h of serum starvation. d Representative Western blot image showing the activation of the PI3K-Akt-mTOR pathway. rMSCs were infected with LV-nc or LV-IRS-1 and transfected with the miR-337 mimic as indicated sequentially, followed by 10% CMS stimulation for 24 h after 8 h of serum starvation. e, f Flow cytometry analysis showing the percentage of EdU+ con-rMSCs or mut-rMSCs after transfection with the miR-337 inhibitor or mimic as indicated, followed by treatment with 0% CMS or 10% CMS for 24 h after 8 h of serum starvation. g Quantitative RT-PCR was used to measure the expression of miR-337 in hMSCs treated as indicated for 24 h after they were serum-starved for 8 h. h, j Flow cytometry analysis showing the percentage of EdU+ hMSCs after transfection with the miR-337 inhibitor or mimic as indicated, followed by treatment as indicated for 24 h after being serum-starved for 8 h. i, k Representative Western blot images showing the activation of the PI3K-Akt-mTOR pathway in hMSCs. The cells were transfected with the miR-337 inhibitor or mimic before being treated as indicated for 24 h after being serum-starved for 8 h. Statistical significance was assessed by Student’s t-test of the results from 3 independent experiments. n = 3 per group. *P < 0.05, **P < 0.01, and ***P < 0.001. The data are means ± SD. The miR-337 expression levels were normalized to those of U6.
Fig. 5
Fig. 5. MSCs sense stress stimulation through the Piezo1-miR-337-PI3K-Akt axis.
a Representative Western blot images showing the Piezo1 protein level at 72 h after siRNA transfection. b Quantitative RT-PCR analysis of the expression of miR-337 in rMSCs transfected with the Piezo1 si-RNA followed by treatment with 0% CMS or 10% CMS for 24 h after 8 h of serum starvation. c Flow cytometry analysis showing the percentage of EdU+ rMSCs after transfection with the Piezo1 si-RNA, followed by treatment with 0% CMS or 10% CMS for 24 h after 8 h of serum starvation. d Representative Western blot images showing the activation of the PI3K-Akt-mTOR pathway. rMSCs were transfected with the Piezo1 si-RNA before they were subjected to 0% CMS or 10% CMS for 24 h after 8 h of serum starvation. e Quantitative RT-PCR was used to measure the expression of miR-337 in rMSCs treated with DMSO or Yoda1 and transfected with the miR-337 mimic as indicated simultaneously, followed by treatment with 0% CMS or 10% CMS for 24 h after 8 h of serum starvation. f Flow cytometry analysis showing the percentage of EdU+ rMSCs after treatment with DMSO or Yoda1 and transfection with the miR-337 mimic as indicated simultaneously, followed by treatment with 0% CMS or 10% CMS for 24 h after 8 h of serum starvation. g Representative Western blot images showing the activation of the PI3K-Akt-mTOR pathway. rMSCs were treated with DMSO or Yoda1 and simultaneously transfected with the miR-337 mimic as indicated, followed by treatment with 0% CMS or 10% CMS for 24 h after 8 h of serum starvation. h Schematic illustration of the TEAD binding site in the wild-type and mutant miR-337 promoters. The TEAD binding motif in the promoter of miR-337 was predicted using the JASPAR database. i Fluorescence activity in 293 T cells expressing the miR-337 wild-type or mutant promoter with TEAD pcDNA3.1. j Representative Western blot images showing the YAP protein level at 72 h after siRNA transfection. k Quantitative RT-PCR analysis of the expression of miR-337 in rMSCs treated with DMSO or Yoda1 and transfected with the YAP si-RNA simultaneously for 24 h after 8 h of serum starvation. l Quantitative RT-PCR analysis of the expression of miR-337 in rMSCs treated with the indicated medium for 24 h after 8 h of serum starvation. Statistical significance was assessed by Student’s t-test of the results from 3 independent experiments. n = 3 per group. *P < 0.05, **P < 0.01, and ***P < 0.001. The data are presented as means ± SD. The miR-337 expression levels were normalized to those of U6.
Fig. 6
Fig. 6. Knockout of miR-337 reversed mechanical unloading-induced bone loss.
a Representative images of micro-CT and bone histomorphometry. WT and miR-337/– rats were suspended by the tail for 28 days before the femurs were used for micro-CT scanning. n = 6 per group. b Quantification of the three-dimensional microstructural parameters from micro-CT scans of femurs. c Representative images showing the flow cytometry analysis of CD45/CD31LepR+ cells in the BM of WT and miR-337/– rats suspended for 7 days. d An EdU incorporation assay was used to determine the percentage of proliferative LepR+ cells in the BM of WT- or KO-rats after being suspended for 7 days. e CFU frequencies of BM cells isolated from WT- or KO-rats after being suspended for 7 days. Colonies larger than 40 cells were counted. f The number of subsets of LepR+ cells counted in 3 BM niches (< 50 μm) from mIHC images. g Heatmap of 21 DEGs enriched in the PI3K-Akt pathway, whose expression changed after 10% CMS in wild-type MSCs, but did not change significantly in KO-MSCs stimulated with FBS or 10% CMS. h Representative images of Western blots showing PI3K-Akt-mTOR pathway activity in WT- and miR-337/– MSCs after serum starvation for 12 h. Statistical significance was assessed by Student’s t-test of the results from 3 to 6 independent experiments. All the data are presented as the means ± SD. *P < 0.05, **P < 0.01, and ***P < 0.001.
Fig. 7
Fig. 7. miR-337/– MSCs ameliorated the HU-induced decrease in bone formation.
a Flow cytometry analysis of EdU+ MSCs treated as indicated for 24 h. b Representative images of the CFU frequency of WT- and miR-337–/– MSCs in the growth medium either without serum or supplemented with a PI3K inhibitor (LY) or an mTOR inhibitor (Rapa). c The number of colonies containing more than 40 cells was quantified. d Representative images of ALP staining and ARS staining of WT- and miR-337–/– MSCs treated as indicated. e Quantification of the staining intensity in three independent experiments. f Relative expression of Runx2 and Col1a1 in WT- and miR-337–/– MSCs treated as indicated for 7 days. The data are normalized to the level of GAPDH. g Schematic of the in vivo transplantation assays. h Representative micro-CT images of femurs from WT rats suspended for 28 days. i Quantification of three-dimensional microstructural parameters from micro-CT scans of femurs. The baselines (black dotted lines) indicate the parameters of WT rats under WB conditions. j Flow cytometry analysis of transplanted GFP+ cells in the BM of WT rats suspended for 7 days. k Representative images of EdU+GFP+ cells in the BM of WT rats suspended for 7 days. l Flow cytometry analysis of endogenous CD45/CD31LepR+ cells in the BM of WT rats transplanted with the indicated cells before 7 days of HU. The statistical significance of the results shown in (af and jl) was assessed by Student’s t-test of 3 to 6 independent experiments. The data are represented as the means ± SDs. The statistical significance of the results from the experiments shown in i was assessed by one-way ANOVA with Dunnett’s post hoc test. n = 6 per group. The data are presented as means ± SEM. *P < 0.05, **P < 0.01, and ***P < 0.001.
Fig. 8
Fig. 8. Schematic diagram illustrating the regulation of mesenchymal stem cell proliferation by mechanical stress via miR-337 expression.
HU results in the loss of mechanical stress around quiescent LepR+ mesenchymal stem cells, leading to the closure of the Piezo1 channel. Through the YAP-TEAD pathway, this closure increases the expression of miR-337, which inhibits the PI3K-Akt-mTOR signaling pathway. Consequently, the number of activated LepR+ MSCs in adult BM decreases, contributing to bone loss.

References

    1. Roberts, D. R. et al. Effects of spaceflight on astronaut brain structure as indicated on MRI. N. Engl. J. Med.377, 1746–1753 (2017). - PubMed
    1. Mishra, B. & Luderer, U. Reproductive hazards of space travel in women and men. Nat. Rev. Endocrinol.15, 713–730 (2019). - PMC - PubMed
    1. da Silveira, W. A. et al. Comprehensive multi-omics analysis reveals mitochondrial stress as a central biological hub for spaceflight impact. Cell183, 1185–1201.e20 (2020). - PMC - PubMed
    1. Zayzafoon, M., Meyers, V. E. & McDonald, J. M. Microgravity: the immune response and bone. Immunol. Rev.208, 267–280 (2005). - PubMed
    1. Bikle, D. D., Halloran, B. P. & Morey-Holton, E. Space flight and the skeleton: lessons for the earthbound. Endocrinologist7, 10–22 (1997). - PubMed

LinkOut - more resources