. 2025 Aug 25;16(1):7901.
doi: 10.1038/s41467-025-63292-7.

DNA double-strand break end resection factors and WRN facilitate mitotic DNA synthesis in human cells

Affiliations

DNA double-strand break end resection factors and WRN facilitate mitotic DNA synthesis in human cells

Szymon A Barwacz et al. Nat Commun. .

Abstract

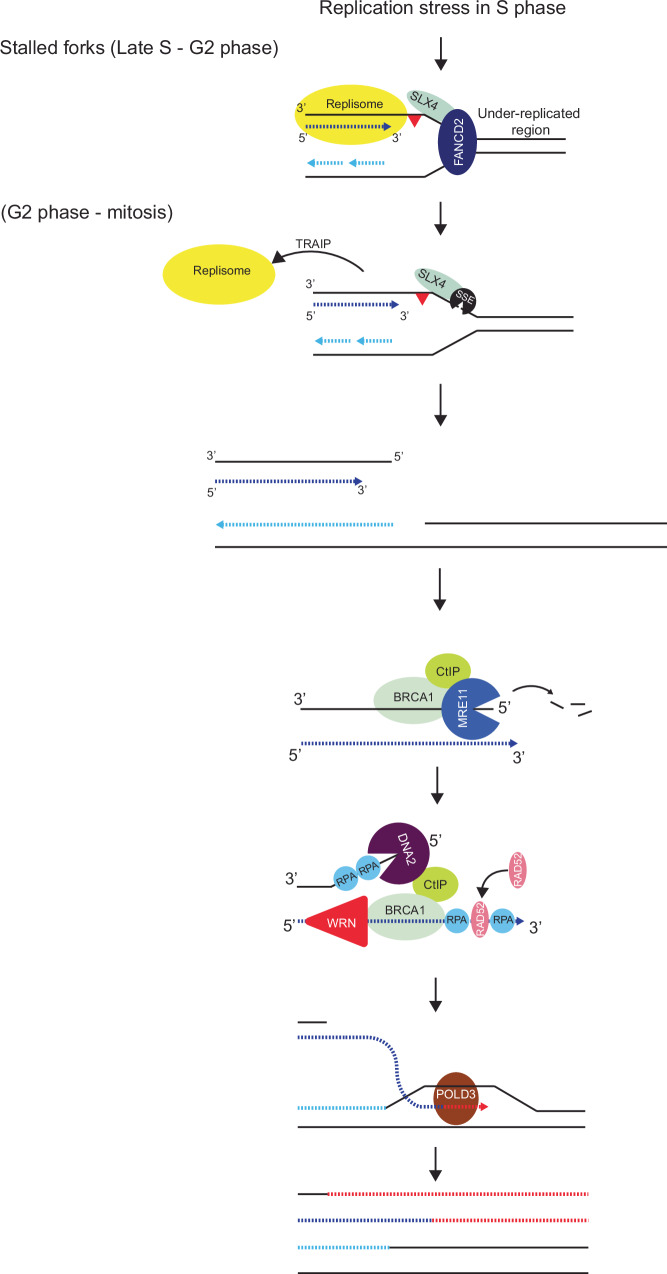
Mitotic DNA synthesis (MiDAS) serves to complete the replication of genomic loci that are not fully replicated in S phase in response to replication stress. Previous studies suggest that MiDAS might proceed via break-induced DNA replication, a sub-pathway of homologous recombination repair activated at broken or collapsed replication forks. We set out to define whether DNA double strand break end-resection factors play a role in MiDAS. Here, we show that several core end-resection factors, including MRE11, CtIP and BRCA1 are essential for MiDAS. In addition, while loss of WRN or DNA2 impairs MiDAS, there is no requirement for other known end-resection factors such as EXO1 and BLM. Moreover, both the exonuclease and the helicase activities of WRN contribute to MiDAS. Because oncogene-induced replication stress is common in cancers, targeting of WRN or other factors required for MiDAS could facilitate the development of targeted cancer therapies.


Conflict of interest statement

Competing interests: The authors declare no competing interests.

Figures

Fig. 1
Fig. 1. Loss of function of MRE11 affects MiDAS formation when cells are challenged with replication stress.
a Experimental workflow for analyzing MiDAS in HCT116 MRE11-AID cells following APH treatment. To enrich mitotic cells, cells were treated with RO3306 for 6 hours, and then released into M phase with medium containing EdU, and with (or without) IAA for 30 minutes, which can induce rapid degradation of MRE11. Mitotic cells were then harvested by mitotic shake-off before being fixed and analyzed for MiDAS. b Western blot analysis of the expression of MRE11 following a one-hour incubation with IAA. GAPDH was used as loading control. Each experiment was repeated independently with similar results at least three times. Representative immunofluorescence images (c) and quantification (d) of prometaphase cells (HCT116 MRE11-AID) showing MiDAS. e Experimental workflow for analyzing MiDAS in HCT116 MRE11-AID cells following APH treatment in S-phase and inhibition of MRE11 function by mirin in early mitosis. Representative immunofluorescence images (f) and quantification (g) of prometaphase cells (HCT116 MRE11-AID) with MiDAS. h Experimental workflow for analyzing MiDAS in U2OS cells following APH treatment in S-phase and inhibition of MRE11 function by MRE11 inhibitors PFM01 or PGM39 in early mitosis. Representative immunofluorescence images (i) and quantification ( j) of prometaphase cells (U2O) with MiDAS. In all cases, ongoing MiDAS was labeled using EdU (red), and DNA was stained with DAPI (blue). Scale bars, 10 μm. In each quantification, data are presented as mean ± s.e.m. of 3 independent experiments. n = 150: 50 cells were analyzed in each condition in each replicate. In total, 150 cells were analyzed for each condition. Statistical p values were calculated using two-tailed non-parametric Mann–Whitney tests and indicated in quantification graphs. Source data are provided as a Source Data file.
Fig. 2
Fig. 2. Loss of function of MRE11 affects the chromatin binding of other DSB end resection factors, RAD52 and POLD3 following replication stress in U2OS cells.
a Experimental workflow of cell synchronization for analyzing the chromatin-bound proteins at different stages of the cell cycle following siRNA to deplete MRE11 and APH treatment in S-phase. b Western blot analysis of soluble or chromatin-bound fraction of BRCA1, WRN, RAD50, BLM, DNA2, CtIP, phosphorylated CtIP, NBS1, POLD3, RAD52, RAD51, and RPA32 at the indicated cell cycle phases. A black arrow indicates the band of BLM detected with BLM antibody, while the star indicates a non-specific band. GAPDH or Histone H3 was used as loading control for soluble and chromatin bound proteins respectively. This experiment was repeated independently with similar results for three times. Source data are provided as a Source Data file.
Fig. 3
Fig. 3. Loss of CtIP or BRCA1 affects MiDAS formation when cells are challenged with replication stress.
a Experimental workflow for analyzing MiDAS in U2OS cells following APH treatment in S-phase and depletion of CtIP or BRCA1 by siRNAs. b Western blot analysis of the expression of CtIP at the end of G2 phase. Tubulin was used as loading control. This experiment was repeated independently with similar results at least three times. Representative immunofluorescence images (c) and quantification (d) of prometaphase cells showing MiDAS. e Western blot analysis of the expression of BRCA1 at the end of G2 phase. Tubulin was used as loading control. This experiment was repeated independently with similar results at least three times. Representative immunofluorescence images (f) and quantification (g) of prometaphase cells (U2OS). In all cases, ongoing MiDAS was labeled using EdU (red), and DNA was stained with DAPI (blue). Scale bars, 10 μm. In each quantification, data are presented as mean ± s.e.m. of at least 3 independent experiments. n = 150: 50 cells were analyzed in each condition in each replicate. In total, 150 cells were analyzed for each condition. Statistical p values were calculated with two-tailed non-parametric Mann–Whitney tests and indicated in quantification graphs. Source data are provided as a Source Data file.
Fig. 4
Fig. 4. Loss of function of DNA2, but not EXO1, affects MiDAS formation when cells are challenged with replication stress.
a Experimental workflow for analyzing MiDAS in U2OS cells following APH treatment in S-phase and depletion of DNA2 by siRNAs. b Western blot analysis of the expression of DNA2 at the end of G2 phase. Tubulin was used as loading control. This experiment was repeated independently with similar results at least three times. Representative immunofluorescence images (c) and quantification (d) of prometaphase cells (U2OS). e Experimental workflow for analyzing MiDAS in U2OS cells following APH treatment in S-phase and inhibition of DNA2 activity in early mitosis using the inhibitor C5. Representative immunofluorescence images (f) and quantification (g) of prometaphase cells with MiDAS. h Experimental workflow for analyzing MiDAS in U2OS cells with or without EXO1 expression following APH treatment in S-phase. i Western blot analysis of the expression of EXO1 in EXO1 (+/+) and EXO1 (−/−) U2OS cells. Tubulin was used as loading control. This experiment was repeated independently with similar results at least three times. Representative immunofluorescence images (j) and quantification (k) of prometaphase cells (U2OS). In all cases, ongoing MiDAS was labeled using EdU (red), and DNA was stained with DAPI (blue). Scale bars, 10 μm. In each quantification, data are presented as mean ± s.e.m. of at least 3 independent experiments. n = 150: 50 cells were analyzed in each condition in each replicate. In total, 150 cells were analyzed for each condition. Statistical p values were calculated with two-tailed non-parametric Mann–Whitney tests and indicated in quantification graphs. Source data are provided as a Source Data file.
Fig. 5
Fig. 5. Loss of WRN, but not BLM, affect MiDAS formation when cells are challenged with replication stress.
a Experimental workflow for analyzing MiDAS in HCT116 WRN-BdTAG cells coupled with siRNA treatment to deplete BLM. b Western blot analysis of BLM and WRN following siRNA transfection in HCT116 WRN-BdTAG cells where WRN could be degraded upon 30 minutes treatment with AGB1. A black arrow indicates the band of BLM detected with BLM antibody, while the star indicates a non-specific band. GAPDH was used as loading control. This experiment was repeated independently with similar results at least three times. Representative immunofluorescence images (c) and quantification (d) of prometaphase cells with MiDAS. e Experimental workflow for analyzing MiDAS in U2OS cells following APH treatment in S-phase inhibition of WRN helicase activity by HR0761 at late G2 and early M phase (1.5 hours in total). Representative immunofluorescence images (f) and quantification (g) of prometaphase cells showing MiDAS. In all cases, ongoing MiDAS was labeled using EdU (red), and DNA was stained with DAPI (blue). Scale bars, 10 μm. In each quantification, data are presented as mean ± s.e.m. of 3 independent experiments. n = 150: 50 cells were analyzed in each condition in each replicate. In total, 150 cells were analyzed for each condition. Statistical p values were calculated with two-tailed non-parametric Mann–Whitney tests and indicated in quantification graphs. Source data are provided as a Source Data file.
Fig. 6
Fig. 6. Both exonuclease and helicase functions of WRN facilitate MiDAS.
a Experimental workflow for analyzing MiDAS in SW620 WRN-BdTAG cells following APH treatment in S-phase and degradation of WRN with AGB1 treatment for one hour at late G2 phase early M phase. b Western blot analysis of the expression of WRN at the end of G2 phase. Tubulin was used as loading control. This experiment was repeated independently with similar results at least three times. Representative immunofluorescence images (c) and quantification (d) of prometaphase cells (U2OS). e Experimental workflow for analyzing MiDAS in HCT116 WRN-BdTAG cells following APH treatment in S-phase and degradation of WRN with AGB1 treatment for one hour at late G2 phase early M phase. This batch of cells were also subject to transfection with plasmids expressing wild type (WT) or mutant WRN with inactivation of exonuclease function (WRN E84A), or helicase function (WRN K577M), or both (WRN E84A/K577M). Representative immunofluorescence images (f) and quantification (h) of prometaphase cells with MiDAS. g Western blot analysis of the expression of endogenous WRN and Myc-tag of exogenous expressed WRN-myc. Tubulin was used as loading control. This experiment was repeated independently with similar results at least three times. In all cases, ongoing MiDAS was labeled using EdU (red), and DNA was stained with DAPI (blue). Scale bars, 10 μm. In each quantification, data are presented as mean ± s.e.m. of at least 3 independent experiments. n = 150: 50 cells were analyzed in each condition in each replicate. In total, 150 cells were analyzed for each condition. Statistical p values were calculated with two-tailed non-parametric Mann–Whitney tests and indicated in quantification graphs. Source data are provided as a Source Data file.
Fig. 7
Fig. 7. Loss of WRN affects MiDAS at both telomeric and non-telomeric loci.
a Experimental workflow for analyzing MiDAS in metaphase spreads of U2OS cells coupled with telomere detection with FISH using a telomere PNA probe, and IF analysis of co-localization of MiDAS and FANCD2. b Western blot analysis of the expression of WRN at the end of G2 phase following siRNA and APH treatment. Tubulin was used as loading control. This experiment was repeated independently with similar results at least three times. c Representative immunofluorescence images, and quantification (d–g) of MiDAS (red) and telomeres (green) in metaphase chromosomes. n = 90: 30 cells were analyzed in each condition in each replicate (90 cells were analyzed for each condition in total) in metaphase chromosome analysis. h Representative immunofluorescence images, and quantification (i) of MiDAS (red) and FANCD2 (green) in prometaphase cells. DNA was stained with DAPI (blue). Scale bars, 10 μm. In each quantification, data are presented as mean ± s.e.m. of at least 3 independent experiments. n = 120: 40 cells were analyzed in each condition in each replicate (120 cells were analyzed for each condition in total) in prometaphase cell analysis. Statistical p values were calculated with two-tailed non-parametric Mann–Whitney tests in d, e, i, and unpaired two-sided t-tests in f and g. P values are indicated in the quantification graphs. Source data are provided as a Source Data file.
Fig. 8
Fig. 8. Loss of BRCA1, DNA2, MRE11, WRN, but not CtIP, induces the formation of 53BP1 nuclear bodies or micronuclei (MN).
a Experimental workflow for analyzing 53BP1 bodies or MN in the next G1 phase cells following APH treatment in S-phase and depletion of BRCA1, DNA2, CtIP, MRE11, or WRN by siRNAs in U2OS cells. b Western blot analysis of the expression of BRCA1, DNA2, CtIP, MRE11, or WRN at the end of G2 phase. Tubulin was used as loading control in all cases. This experiment was repeated independently with similar results at least three times. Representative immunofluorescence images (c) and quantification of 53BP1 bodies (d) or MN (e). DNA was stained with DAPI (blue). 53BP1 was detected with antibody and is shown red. MN was shown by DAPI and indicated by white arrows. Scale bars, 10 μm. f Experimental workflow for analyzing 53BP1 bodies or MN in the next G1 phase cells following APH treatment in S-phase and inhibition of the function of MRE11 or DNA2 by PMF39 or C5 respectively. Representative immunofluorescence images (g) and quantification of 53BP1 bodies (h) or MN (i). DNA was stained with DAPI (blue). 53BP1 was detected with antibody and is shown red. MN was shown by DAPI and indicated by white arrows. Scale bars, 10 μm. In each quantification, data are presented as mean ± s.e.m. of at least 3 independent experiments. n = 150: 50 pair of new G1 cells were analyzed in each condition in each replicate. In total, 150 pair of new G1 cells were analyzed for each condition. Statistical p values were calculated with two-tailed non-parametric Mann–Whitney tests and indicated in quantification graphs. Source data are provided as a Source Data file.
Fig. 9
Fig. 9. DNA end resection factors bound and function at early M phase following replication stress.
a Experimental workflow for analyzing RPA foci following APH treatment in prometaphase cells coupled with short inhibition to MRE11 (with PFM39), DNA2 (with C5) or WRN (with HRO761) at G2/M boundary. Representative immunofluorescence images (b) and quantification (c) of RPA foci (red). DNA was stained with DAPI (blue). Scale bars, 10 μm. n = 102: over 30 cells were analyzed in each condition in each replicate. In total, 102 cells were analyzed for each condition. d Experimental workflow for analyzing WRN’s localization at loci with replication stress marked by FANCD2 in G2 and early M phase with or without the treatment of APH. Representative immunofluorescence images (e) and quantification of foci (f) that have WRN (red) and FANCD2 (green) co-localization in the nucleus. DNA was stained with DAPI (blue). Scale bars, 10 μm. In each quantification, data are presented as mean ± s.e.m. of at least 3 independent experiments. n = 105: over 30 cells were analyzed in each condition in each replicate. In total, 105 cells were analyzed for each condition. Statistical p values were calculated with two-tailed non-parametric Mann–Whitney tests and indicated in quantification graphs. Source data are provided as a Source Data file.
Fig. 10
Fig. 10. A model to illustrate our current understanding of BIR-like MiDAS.
In G2 phase, at loci where converging replication forks have not yet merged or are stalled due to replication stress in the human genome, the FANCD2 and SLX4 proteins are recruited. When cells enter the prophase of mitosis, the TRAIP ubiquitin ligase unloads the replisome, and DNA structure-specific endonucleases (SSEs) are recruited to the SLX4 scaffold. The stalled fork is then cleaved by one of the SLX4-associated SSEs to create a one-ended double strand break (DSB). Together with BRCA1, CtIP stimulates MRE11’s endonuclease activity and then exonuclease activity leading to a 5’-3’ end resection and creation of 3’ single-stranded DNA (ssDNA) overhang. The overhang continues to be extended, possibly with the cooperation of DNA2 and WRN. In the case of WRN, although it has been proposed to co-operate with DNA2 in long-range DSB resection in in vitro assays, our results indicated that both its 3’-5’ exonuclease and 3’-5’ helicase activity are required for MiDAS. Subsequently, the action of WRN and DNA2 establishes a ssDNA overhang that is sufficiently long and bound by RPA. RAD52 then promotes the annealing of complementary single-stranded DNA (ssDNA) by interacting with RPA, and promoting the removal of RPA from ssDNA. The RAD52-coated DNA promotes ssDNA annealing to the complementary parent strand, making it possible for POLD3-dependent MiDAS to occur in prophase and prometaphase.

Similar articles

References

    1. Zeman, M. K. & Cimprich, K. A. Causes and consequences of replication stress. Nat. Cell Biol.16, 2–9 (2014). - PMC - PubMed
    1. Bertolin, A. P., Hoffmann, J. S. & Gottifredi, V. Under-replicated DNA: the byproduct of large genomes? Cancers (Basel)12, 10.3390/cancers12102764 (2020). - PMC - PubMed
    1. Hua, B. L. & Orr-Weaver, T. L. DNA replication control during drosophila development: insights into the onset of S phase, replication initiation, and fork progression. Genetics207, 29–47 (2017). - PMC - PubMed
    1. Glover, T. W., Wilson, T. E. & Arlt, M. F. Fragile sites in cancer: more than meets the eye. Nat. Rev. Cancer17, 489–501 (2017). - PMC - PubMed
    1. Burrow, A. A., Williams, L. E., Pierce, L. C. & Wang, Y. H. Over half of breakpoints in gene pairs involved in cancer-specific recurrent translocations are mapped to human chromosomal fragile sites. BMC Genom.10, 59 (2009). - PMC - PubMed

MeSH terms

LinkOut - more resources