. 2025 Aug 25;16(1):7913.
doi: 10.1038/s41467-025-63015-y.

ERH promotes primary microRNA processing beyond cluster assistance

Affiliations

ERH promotes primary microRNA processing beyond cluster assistance

Harim Jang et al. Nat Commun. .

Abstract

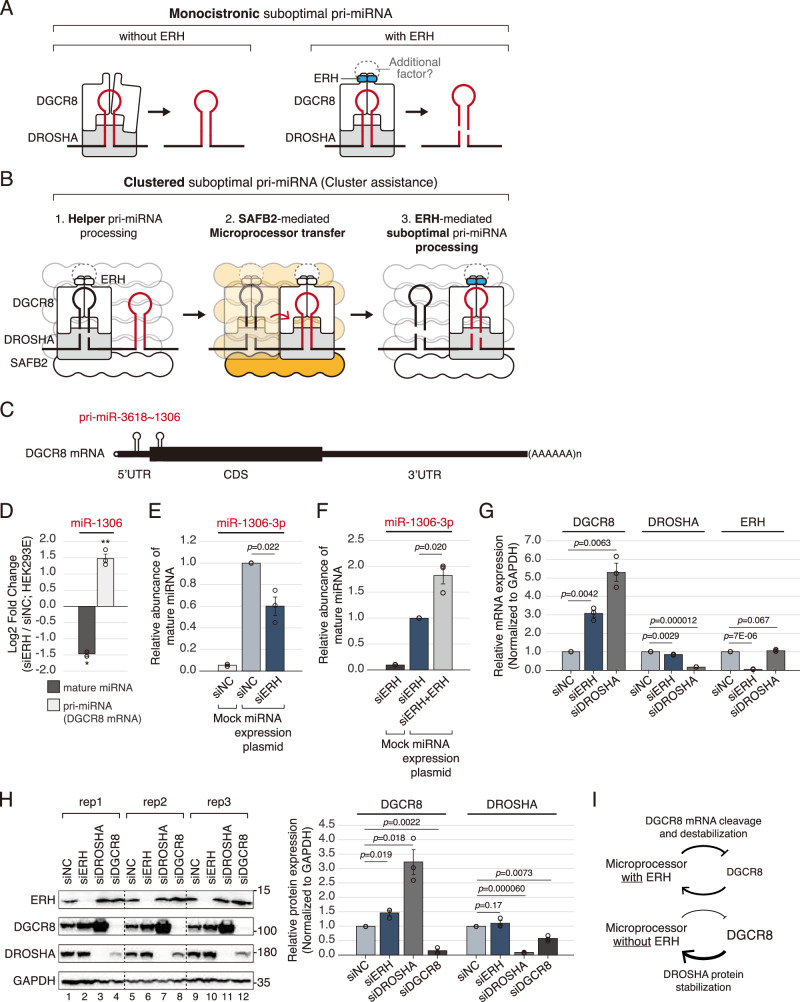
MicroRNA (miRNA) maturation is initiated by the Microprocessor complex, comprising DROSHA and DGCR8, that processes primary miRNAs (pri-miRNAs). Recent studies have identified ERH and SAFB2 as auxiliary factors that enhance the functionality of the Microprocessor. These factors are required for cluster assistance, where optimal pri-miRNAs facilitate the processing of adjacent suboptimal pri-miRNAs. However, the specific action mechanisms of ERH and SAFB2 have not yet been defined. In this study, we found that ERH broadly enhances the processing of pri-miRNAs regardless of their genomic contexts, affecting both stand-alone and clustered ones. Suboptimal hairpins are affected more prominently by ERH knockdown than efficiently processed hairpins. In contrast, SAFB2 specifically supports the processing of suboptimal pri-miRNA hairpins within clusters. This study reveals the distinct roles of ERH and SAFB2 in cluster assistance and presents a new model, in which SAFB2 facilitates the Microprocessor's transfer between hairpins, while ERH enables the efficient processing of suboptimal pri-miRNAs.


Conflict of interest statement

Competing interests: The authors declare no competing interests.

Figures

Fig. 1
Fig. 1. Identification of monocistronic miRNAs regulated by ERH.
A Scatter plots of log2 fold changes of siERH versus DGCR8 ∆ex2. A miRNA is defined as ‘clustered’ if another miRNA gene is found within ±1500 bp in the genome. R is Pearson’s correlation coefficient. B RT-qPCR for the expression levels of pri-miRNAs detected by SYBR Green-based PT-qPCR after knocking down ERH for 4 days, and those of miRNAs were deduced from small RNA-seq. RT-qPCR data shown represent the average of three biological replicate experiments. Error bars indicate the standard error of the mean. Statistical analysis was performed using a one-sided Student’s t-test against the null hypothesis of no change. *P < 0.05; N.S. denotes not significant. RT-qPCR representing relative miRNA abundance level upon ERH knockdown with ectopically expressed pri-miRNA (C) pri-miR-589 or 365a or 197 (n = 4), D pri-miR-589 of varying length and genomic locus (n = 3), E mutant pri-miR-589 or 365a in GNAI3 exon9 (n = 3). After 2 days of ERH knockdown, pri-miRNA expression plasmids were transfected with additional siRNA. RT-qPCR data shown represent the average of biological replicate experiments. Error bars indicate the standard error of the mean. Statistical analysis was performed using a one-tailed Student’s t-test. RT-qPCR representing relative miRNA abundance level upon ERH knockdown with artificial pri-miR-144 ~ 589 plasmids with varying distances between two clustered hairpins. The relative abundance against the “siNC_892nt spacer” sample is illustrated in (F), while the relative abundance of each plasmid is illustrated in (G). After 2 days of ERH knockdown, pri-miRNA expression plasmids were transfected with additional siRNA. The data shown represent the average of three biological replicate experiments. Error bars indicate the standard error of the mean. Statistical analysis was performed using a one-tailed Student’s t-test. All source data are provided as a Source data file.
Fig. 2
Fig. 2. ERH-mediated promotion of suboptimal pri-miRNAs processing.
A Scatter plots of log2 fold changes of siERH versus in vitro processing efficiency of pri-miRNA hairpins. r is Pearson’s correlation coefficient. B RT-qPCR showing ERH dependence of ectopically expressed pri-miRNAs. After 2 days of ERH knockdown, pri-miRNA expression plasmids were transfected with additional siRNA. The data shown represent the average of three biological replicate experiments. Error bars indicate the standard error of the mean. Statistical analysis was performed using a one-tailed Student’s t-test. C Schematic diagram of plasmids that modify the hairpin of 451a in the miR-144-451a cluster and RT-qPCR showing ERH dependence of miR-451a mutants. After 2 days of ERH knockdown, pri-miRNA expression plasmids were transfected with additional siRNA. The data shown represent the average of 4 biological replicate experiments. Error bars indicate the standard error of the mean. Statistical analysis was performed using a one-tailed Student’s t-test. D Schematic diagram of artificial pri-miRNA that differ in the presence or absence of the pri-miRNA motifs and RT-qPCR showing ERH dependence of artificial miRNA. After 2 days of ERH knockdown, pri-miRNA expression plasmids were transfected with additional siRNA. The data shown represent the average of three biological replicate experiments. Error bars indicate the standard error of the mean. Statistical analysis was performed using a one-tailed Student’s t-test. All source data are provided as a Source data file.
Fig. 3
Fig. 3. In vitro validation of ERH-mediated regulation of monocistronic pri-miRNA.
A Schematic diagram of in vitro pri-miRNA processing and DGCR8 variants used in the assay. Repoter RNAs were labeled with radioisotope (RI; ATP-[γ−32P]) at the 5’ end. B Schematic diagram of the structure and motifs of pri-miR-144, pri-miR-197, and pri-miR-589 based on a previous publication. C Representative gel images from time course in vitro processing of RI-labeled pri-miRNA and quantification of the intensities of the cleaved 5’ fragment of pri-miRNA bands (arrowheads) from two independent replicates. Corresponding rate constants for wild-type DGCR8 (kWT in red), DGCR8 ΔBS (k∆BS in black), and DGCR8 ΔN (k∆N in gray) are indicated. The levels of Microprocessor components were quantified by performing western blot analysis (Supplementary Fig. 2A). D Representative gel images from time course in vitro processing of RI-labeled pri-miRNA and quantification of the intensities of the cleaved 5’ fragment of pri-miRNA bands (arrowheads) from three independent replicates. “wERH” indicates ERH wild-type and ‘mERH’ indicates ERH homodimerization mutant (I5R/L7R). Corresponding rate constants for DGCR8 with wERH (kwERH in red) and DGCR8 with mERH (kmERH in black) are indicated. The levels of Microprocessor components was quantified by performing western blot analysis (Supplementary Fig. 2C). Statistical analysis was performed using a one-tailed Student’s t-test. E Schematic diagram of in vitro pri-miRNA processing with nuclear lysate. F Representative gel images from time course in vitro processing of RI-labeled pri-miRNA with nuclear lysates and quantification of the intensities of the cleaved 5’ fragment of pri-miRNA bands (arrowheads) from three independent replicates. Corresponding rate constants for DGCR8 ΔN (k₁ in gray), wild-type DGCR8 (k₂ in black), and wild-type DGCR8 with exogenous ERH (k₃ in red) are indicated. The levels of Microprocessor components were quantified by performing western blot analysis (Supplementary Fig. 2E). Statistical analysis was performed using a one-tailed Student’s t-test. All source data involving replicate data are provided as a Source data file.
Fig. 4
Fig. 4. The specificity of SAFB2 for clustered miRNAs.
A RT-qPCR results for ERH or SAFB2 dependence of monocistronic or artificially clustered pri-miR-589. After 2 days of ERH or SAFB2 knockdown, pri-miRNA expression plasmids were transfected with additional siRNA. The data shown represent the average of three replicate experiments. Error bars indicate the standard error of the mean. Statistical analysis was performed using a one-tailed Student’s t-test. B Schematic diagram of dual luciferase for relative pri-miRNA processing assay and results. After 2 days of ERH or SAFB2 knockdown, luciferase plasmids were transfected with additional siRNA. The data shown represent the average of three replicate experiments. Error bars indicate the standard error of the mean. Statistical analysis was performed using a one-tailed Student’s t-test. C Schematic diagram of tethering assay with λN-tagged DGCR8 and RT-qPCR showing the λN-tagged DGCR8 tethering effect and ERH/SAFB2 dependence of pri-miR-144 and pri-miR-451a with 5XBoxB sequence. After 2 days of ERH or SAFB2 knockdown, pri-miRNA expression plasmids and DGCR8 expression plasmids were co-transfected with additional siRNA. The data shown represent the average of three replicate experiments. Error bars indicate the standard error of the mean. Statistical analysis was performed using a one-tailed Student’s t-test. All source data are provided as a Source data file.
Fig. 5
Fig. 5. Protein interactions among Microprocessor and auxiliary factors.
A Western blots of co-immunoprecipitation assay with overexpressed DROSHA or DGCR8. DROSHA-Flag was co-transfected with the CTT of DGCR8 for efficient expression. 1% input was loaded, based on the total amount used for immunoprecipitation. B Co-Immunoprecipitation western blots of endogenous SAFB2 following ERH knockdown. Non-targeting siRNA was transfected in the absence of knockdown. Four days after knockdown, cells were harvested for further co-IP experiments. 2.5% input was loaded, based on the total amount used for immunoprecipitation. C Co-Immunoprecipitation western blots of endogenous ERH following SAFB2 knockdown. Non-targeting siRNA was transfected in the absence of knockdown. Four days after knockdown, cells were harvested for further co-IP experiments. 2.5% input was loaded, based on the total amount used for immunoprecipitation. DE Co-Immunoprecipitation western blots of ectopically expressed SAFB2 core domain. D HEK293E cell E HCT116 parental or DROSHA knock-out cell. 1% input was loaded, based on the total amount used for immunoprecipitation. F Model of interactions among the Microprocessor and auxiliary factors. All data in AE are from one experiment and are representative of at least two independent replicates with similar results. All source data are provided as a Source data file.
Fig. 6
Fig. 6. The mechanistic hypothesis of cluster assistance.
A Working model of ERH-mediated monocistronic pri-miRNA processing. B Working model of ERH/SAFB2-mediated cluster assistance. C Schematic diagram of DGCR8 mRNA. D RT-qPCR for the expression levels of pri-miR-1306, which is DGCR8 mRNA detected by SYBR Green-based qPT-PCR after knocking down ERH for 4 days, and those of miRNAs were deduced from small RNA-seq. RT-qPCR data shown represent the average of three biological replicate experiments. Error bars indicate the standard error of the mean. Statistical analysis was performed using a one-sided Student’s t-test against the null hypothesis of no change. *P < 0.05; **P < 0.01; N.S. denotes not significant. RT-qPCR representing relative miR-1306 abundance level upon (E) ERH knockdown or (F) ERH rescue with ectopically expressed pri-miR-1306. After 2 days of ERH knockdown, pri-miRNA expression plasmids were transfected with additional siRNA. RT-qPCR data shown represent the average of three biological replicate experiments. Error bars indicate the standard error of the mean. Statistical analysis was performed using a one-tailed Student’s t-test. G RT-qPCR for the comparative expression of proteins by ERH or DROSHA knockdown in HEK293E cells. Cells were harvested after knocking down for 4 days. RT-qPCR data shown represent the average of three biological replicate experiments. Error bars indicate the standard error of the mean. Statistical analysis was performed using a one-tailed Student’s t-test. H Western blot for comparative expression of proteins by ERH or DROSHA, DGCR8 knockdown in HEK293E cells (left) and quantification of the intensities of the protein bands from the experiment in panel (right). Cells were harvested after knocking down for 4 days. Quantification data shown represent the average of three biological replicate experiments. Error bars indicate the standard error of the mean. Statistical analysis was performed using a one-tailed Student’s t-test. I Schematic diagrams of homeostatic mechanisms between ERH and DGCR8. All source data are provided as a Source data file.

Similar articles

References

    1. Bartel, D. P. Metazoan microRNAs. Cell173, 20–51 (2018). - PMC - PubMed
    1. Chen, L.-L. & Kim, V. N. Small and long non-coding RNAs: past, present, and future. Cell187, 6451–6485 (2024). - PubMed
    1. Kim, H., Lee, Y.-Y. & Kim, V. N. The biogenesis and regulation of animal microRNAs. Nat. Rev. Mol. Cell Biol.26, 276–296 (2025). - PubMed
    1. Lee, Y., Jeon, K., Lee, J.-T., Kim, S. & Kim, V. N. MicroRNA maturation: stepwise processing and subcellular localization. EMBO J.21, 4663–4670 (2002). - PMC - PubMed
    1. Cai, X., Hagedorn, C. H. & Cullen, B. R. Human microRNAs are processed from capped, polyadenylated transcripts that can also function as mRNAs. RNA10, 1957–1966 (2004). - PMC - PubMed

LinkOut - more resources