. 2025 Aug 25;16(1):7919.
doi: 10.1038/s41467-025-62934-0.

The HDAC inhibitor romidepsin renders liver cancer vulnerable to RTK targeting and immunologically active

Affiliations

The HDAC inhibitor romidepsin renders liver cancer vulnerable to RTK targeting and immunologically active

Celia Sequera et al. Nat Commun. .

Abstract

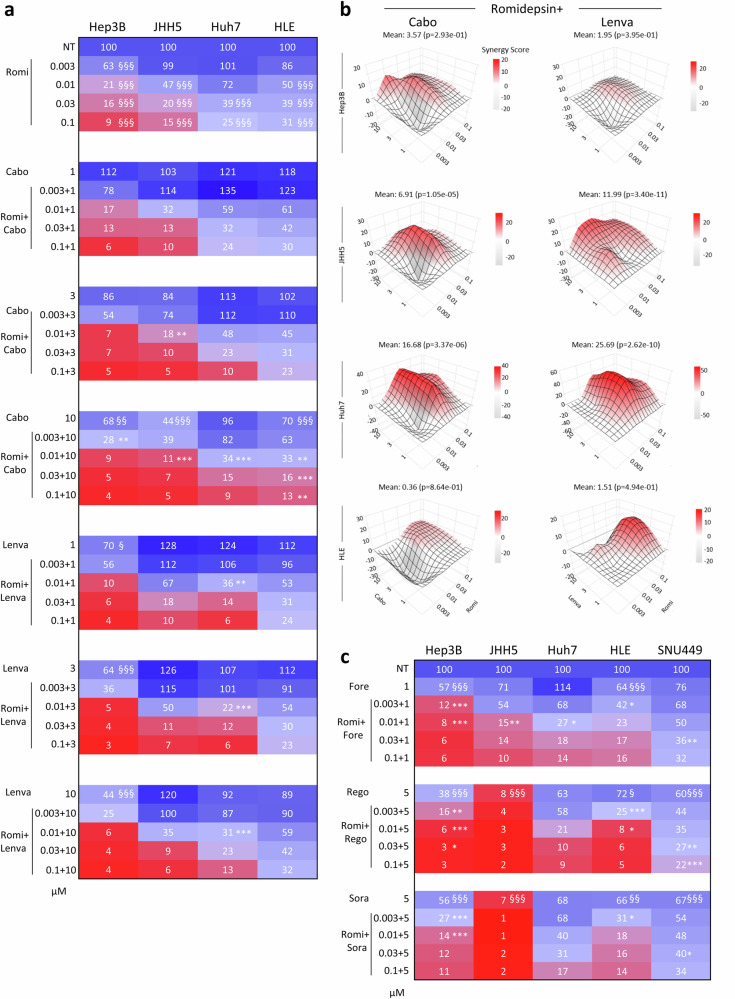
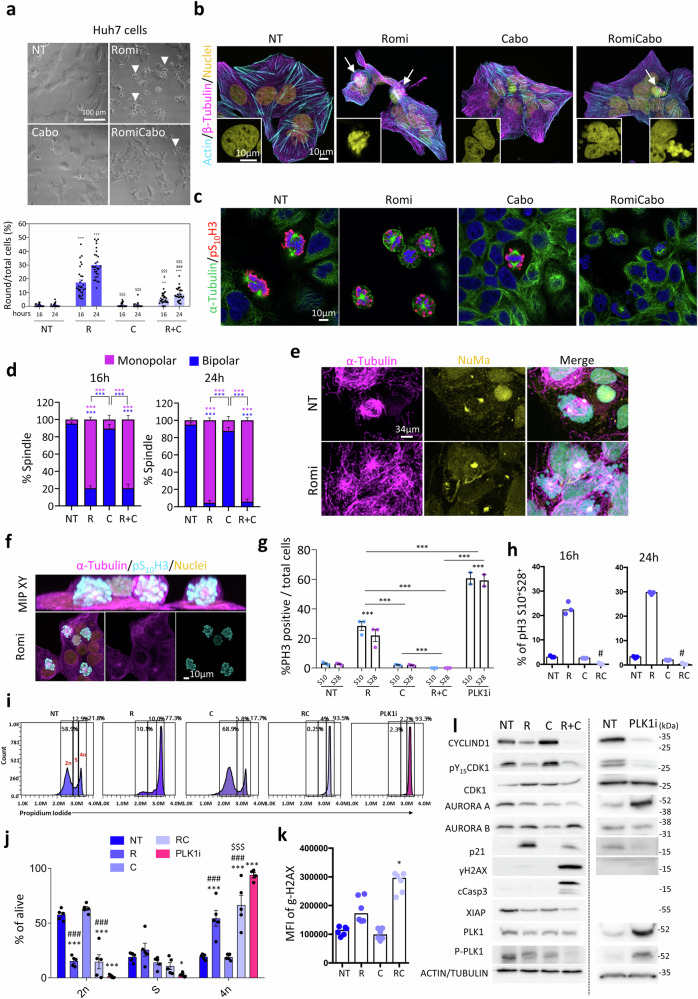
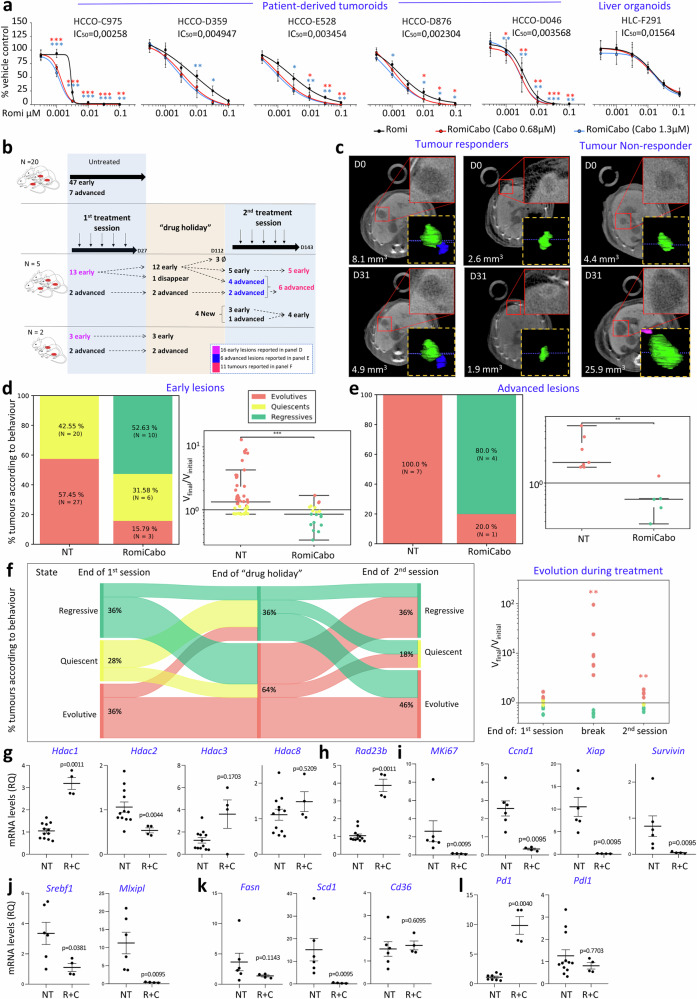
Histone deacetylases (HDACs) are epigenetic regulators frequently altered in cancer. Here we report that overexpression of HDAC1/2 occurs in Hepatocellular Carcinoma (HCC) patients, correlating with poor prognosis. We show that romidepsin, a class-I HDAC inhibitor, elicits a combinatorial perturbation of distinct molecular processes in HCC cells, altering lipid composition, mitotic spindle machinery, and levels of cell cycle/survival signals. Collectively, these alterations lead HCC cells to a vulnerable state, conferring dependency to receptor tyrosine kinase (RTK) signalling support. The cytostatic effects of romidepsin alone is converted into cytotoxicity by the RTK inhibitor cabozantinib in HCC models. We document that romidepsin+cabozantibib confers an immune-stimulatory profile in Alb-R26Met mouse models, with direct effects on primary human dendritic cell maturation in vitro. Our findings put forward the intricate crosstalk between epigenetics, metabolism, and immune response in cancer. The broad action of romidepsin on distinct cellular functions highlights its therapeutic potential for HCC treatment.


Conflict of interest statement

Competing interests: The authors declare no competing interests.

Figures

Fig. 1
Fig. 1. Class-I HDAC expression levels in human HCC patients and correlation with overall survival and disease-free interval.
a, b HDAC1/2 gene expression (left) and curves showing the overall survival and disease-free survival (right), expressed as percentage of HCC patients with high (red) versus low (blue) HDAC1 and HDAC2 levels, in TCGA-LIHC (a; N (C) = 50, N(T) = 371, HDAC1 p < 0.0001, HDAC2 p = 0.0333) and GSE14520 (GPL571 and GPL3921; b; N (C) = 241, N(T) = 247, HDAC1 p < 0.0001, HDAC2 p < 0.0001) cohorts. c–e Boxplot and paired dot plot of HDAC1 and HDAC2 levels in LICA-FR (c; N (C) = 226, N(T) = 161, HDAC1 p < 0.0001, HDAC2 p < 0.0001), LIRI-JP (d; N (C) = 202, N(T) = 243, HDAC1 p < 0.0001, HDAC2 p < 0.0001), and GSE144269 (e; N (C) = 70, N(T) = 70, HDAC1 p < 0.0001, HDAC2 p < 0.0001) human HCC patient cohorts. f Curves showing overall survival (left) and disease-free survival (right) of human HCC patients (n = 247), expressed in percentages, with high (red) versus low (blue) levels of HDAC1/2 (top), and with high-HDAC1/low-HDAC2 (green) versus high-HDAC2/low-HDAC1 (orange; bottom). g mRNA levels of HDAC1 and HDAC2 in a cohort of HCC patients from the STORM clinical trial (GSE109211, n = 140) treated with sorafenib. h HDAC1 and HDAC2 levels expressed as fold change (FC) of FFPE samples from HCC-St.Joseph's cohort (n = 10). i HDAC1/2 expression in the HCC-NatCom cohort, classified by Edmonson histological grading stages (n = 132). j Curves reporting the survival of patients with high (red) versus low (blue) HDAC1 or HDAC2 levels in the HCC-NatCom cohort (n = 132). k, l Dot plots showing levels of protein expression (k) and phosphorylation of different serine residues (l) of HDAC1 and HDAC2 in control (n = 33) and tumour (n = 186) samples from patient biopsies (HCC-NatCom cohort). a–f, k Dot-plot was analysed with two-tailed non-paired (a, b, c, d, k) or paired (e), Mann-Whitney. a, b, f, j Kaplan Meir was analysed with Logrank and/or Grehan-Breslow, exact p values indicated in the figures. g, i Two-tailed non-paired Kruskal-Wallis followed by Dunn’s multiple comparison. significance: *p ≤ 0.05; **p ≤ 0.01; ***p ≤ 0.001. Box plots are represented as min-max, bars represent SEM, and notches represent median levels. C: Control liver tissue; T: tumour tissue. Source data are provided as a Source Data file.
Fig. 2
Fig. 2. Response of human HCC cell lines to HDAC versus BET blockage.
a Heatmap showing the gene expression values for all HDACs (the class is specified on the left) in 32 human HCC cell lines, analysing data at http://zucmanlab.com/. b Heatmap showing the drug response of 32 human HCC cell lines to clinically relevant RTKi (orange) and epigenetic drugs (green), expressed as GI50, extracted from http://zucmanlab.com/. c Dot plot reporting drug response expressed as GI50 of the indicated human HCC cell lines to RTKi currently used in the clinic for HCC treatment (cabozantinib, lenvatinib, sorafenib, regorafenib). Data are presented as mean values +/- SEM. d Heatmap reporting cell viability after 48 h treatment with HDACi (romidepsin, EDOS-101, ACY957, panobinostat) and BETi (JQ1, OTX-015, mivebresib) at the indicated concentrations. Data are expressed as means of at least three independent experiments (scatter dot-plots are reported in Fig. S6 with corresponding statistics). Viability percentages are reported using a blue (high)-to-red (low) colour code (the scale depicted on the right is used as a reference in all viability studies). e Western blots of the reported proteins in the indicated human HCC cell lines non-treated (NT) and treated with romidepsin (0.03 µM) for 8 h and 24 h. Quantifications are reported in Fig. S7 with corresponding independent experiments and statistics. f Western blots displaying expression of the indicated proteins in JHH5 and HLE cells non-treated and treated with mivebresib (1 µM) for 8 h and 24 h (one independent experiment). Source data are provided as a Source Data file.
Fig. 3
Fig. 3. Romidepsin sensitises human HCC cells to RTKi.
a Heatmap reporting effects on viability of cells exposed to romidepsin (Romi), cabozantinib (Cabo) or lenvatinib (Lenva), alone or in combination, at the indicated doses (µM) for 48 h. Cells were treated with the indicated inhibitors, alone and in combinations by adding the drugs at the same time (24 h after seeding). Data are the mean of three independent experiments. Scatter dot plots are shown in Fig. S8 with corresponding statistics, two-tailed one-way ANOVA followed by Tukey multiple comparison; p < 0.0001 for all cell lines. b Synergy maps for the indicated drug combinations reported in (a). c Heatmap showing the effects on viability of cells following combined treatments of romidepsin with foretinib (Fore), regorafenib (Rego), or sorafenib (Sora) for 48 h. Data are the mean of three independent experiments (full heatmap including romidepsin and cabozantinib treatment is reported in Fig. S9, scatter dot plots are shown in Fig. S10 with corresponding statistics, two-tailed one-way ANOVA followed by Tukey multiple comparison; p < 0.0001 for all cell lines). Significance: *: p < 0.05; **,§§: p < 0.01; ***,§§§: p < 0.001. § indicates single treatments versus controls; * indicates combined treatments versus their respective single treatments. Source data are provided as a Source Data file.
Fig. 4
Fig. 4. Romidepsin perturbs lipid metabolism in human HCC cells.
a Top panels: graphs reporting top-15 most significant enriched pathways according to GO_Biological_Process analyses in Huh7 cells treated with romidepsin (Romi), cabozantinib (Cabo), and RomiCabo versus non-treated cells (NT). Bottom panels: graphs reporting top-20 enrichments based on GO_Biological_Process analysis, with up-regulated (left) and down-regulated (right) pathways in the indicated conditions (RomiCabo versus cabozantinib-treated Huh7 cells). Pathways related to the mitotic spindle and lipid metabolism are highlighted in green and orange, respectively. Complete proteomics data are in Supplementary Data 1-10. b Heatmap reporting z-score values of proteins related to fatty acids and triglycerides, cholesterol, and ceramides metabolic pathways in the indicated conditions (R: romidepsin; C: cabozantinib; R + C: RomiCabo). a, b A two-tailed heteroscedastic t-test was performed between each condition. Proteins with p values < 0.05 were considered as significant; n = 3 independent biological experiments. c, d Heatmap representation of unsupervised hierarchical clustering and principal component analysis (PCA) plots from lipidomic analysis of ceramides (c) and lysophospholipids (d) in Huh7 and Hep3B cells. e Triacylglycerols dot-plots for association of carbon atoms (fatty acid chain length) and double-bonds (saturation) from lipidomic analysis. Each lipid is represented by a circle and the colour of the circle correlates with the condition association direction (red: positive, blue: negative). The size of the circle correlates with the statistical significance (larger circles represent smaller p-values). c–e Multivariate (PCA, Hierarchical heatmap); n = 4 independent biological experiments. Source data are provided as a Source Data file.
Fig. 5
Fig. 5. Romidepsin perturbs the expression of lipid regulators through LXR and FXR pathways.
a Top-15 most significant enriched pathways according to IPA analyses from the proteome of Huh7 cells treated with romidepsin (Romi), cabozantinib (Cabo), or RomiCabo versus non-treated cells (NT). Pathways related to LXR/RXR and FXR/RXR are highlighted in blue. b z-score from the proteome for proteins related to LXR/RXR (green) or FXR/RXR (red); some proteins have overlapping upstream regulators LXR and FXR. (a, b) A two-tailed heteroscedastic t-test was performed between each condition. Protein with p values < 0.05 were considered as significant; n = 3 independent biological experiments. c Scheme illustrating the explored mechanism of action of romidepsin in relation to LXR/RXR and FXR/RXR pathways and  lipid metabolism regulation. d LXR luciferase reporter assay in non-treated and treated Huh7 cells. Luciferase activity is reported as arbitrary units (a.u). An LXR agonist (GSK3987) was used as a positive control (n = 3 independent biological experiments; p < 0.0001). e mRNA expression by RT-qPCR (expressed as RQ) of SREBF1, MLXIPL, CD36, and SCD1 in romidepsin (R), cabozantinib (C), or RomiCabo versus non-treated Huh7 cells. On the right of each graph are values corresponding to cells after treatment with FXR agonist (FXR agonist 3), LXR agonist (GSK3987), or LXR antagonist (GSK2033), either alone or in combination with romidepsin and RomiCabo (at least four independent experiments; SREBF1, MLXIPL, CD36, and SCD1 p < 0.0001). f, g mRNA expression by RT-qPCR of CYP7A1 (n = 11 independent biological experiments, p = 0.0077) (f), ACACA (n = 7 independent biological experiments, p = 0.0043), and FASN (n = 4 independent biological experiments, p < 0.0001) (g) in the indicated conditions. h Representations of different transcriptional expression outcomes in LXR and/or FXR pathways after treatment with romidepsin. d–g two-tailed unpaired one-way ANOVA followed by Tukey’s (d, e) or Dunnet’s (f, g) multiple comparison. Significance: *,$,#,%,£p < 0.05; **,$$,##,%%,££p < 0.01; ***,$$$,###,%%%,£££p < 0.001. * is comparison versus NT or as indicated by the statistical lines; $ versus romi; # versus cabo; % versus RomiCabo; £ versus FXR agonist+Romi. Schemes in c and h were performed with public open source Servier Medical Art, licensed under CC BY 4.0. Source data are provided as a Source Data file.
Fig. 6
Fig. 6. Romidepsin treatment causes mitotic spindle defects and perturbs cell cycle progression in human HCC Huh7 cells.
a Representative bright-field images of Huh7 cells non-treated (NT), treated with romidepsin (Romi), cabozantinib (Cabo), or RomiCabo for 24 h. White arrowheads indicate round cells. Percentage of round cells (normalized over total cell number, n = 3 independent biological experiments; p < 0.0001)). b Immunostaining of Huh7 cells after 24 h of treatment: Actin (cyan), β-Tubulin (magenta), Nuclei (yellow; n = 3 independent biological experiments). White arrows indicate round cells. c, d Immunostaining of monopolar and bipolar spindles with α-Tubulin (green), pS10H3 (red), nuclei (blue), (n = 3 independent biological experiments; p < 0.0001). e Immunostaining of aberrant spindles with NuMa (yellow) and α-Tubulin (magenta; n = 3 independent biological experiments). f Maximal intensity projection (MIP) in XY plan of Huh7 cells treated for 24 h with romidepsin: α-Tubulin (magenta), pS10H3 (cyan), nuclei (yellow), reported as representative 3D reconstruction. g pS10H3 (S10) and pS28H3 (S28) positive cells at 24 h in non-treated (NT), romidepsin (R), cabozantinib (C), RomiCabo (R + C), and PLK1i conditions, normalised over total cell number (DAPI; n = 3 independent biological experiments; p < 0.0001). h Percentage of double-positive pS10H3 and pS28H3 alive cells after 16 h (left; n = 3 independent biological experiments; p = 0.0017) and 24 h (right; n = 3 independent biological experiments; p = 0.0017) of indicated treatments, measured by flow cytometry. i, j Representative cytometry profiles (i) of the DNA content (2n, S, 4n) of alive cells after 24 h, with Propidium Iodide and (j) quantification among alive cells (n = 5 independent biological experiments; p < 0.0001). k Median fluorescence intensity (MFI) of γH2AX among live cells after 24 h by flow cytometry (n = 6 independent biological experiments; p < 0.0001). l Western blots of reported signalling proteins (quantifications are shown in Figs. S17–18, 23 with the corresponding statistics, n = 3 independent biological experiments). Statistical analysis was performed with one-way ANOVA (a, g) or two-way ANOVA (d), followed by Tukey multiple comparison (a, d, g). Paired two-tailed Friedman followed by Dunn’s multiple comparison (h, k). Unpaired two-tailed two-way ANOVA followed by Dunnet’s multiple comparison (j). In (g, i, j) PLK1i condition was used as positive control of mitotic arrest. Levels of significance: *,$,#p ≤ 0.05; **,$$,##p ≤ 0.01; ***,$$$,###p ≤ 0.001. Bars represent SEM and notches in dot-plots represent mean levels. *indicates the significance between treated versus non-treated cells; $is versus romidepsin; #is versus cabozantinib. Source data are provided as a Source Data file.
Fig. 7
Fig. 7. RomiCabo effects on patients derived tumoroids and on spontaneous tumours in the Alb-R26Met HCC mouse model.
a Viability of patient-derived tumoroids and liver organoids in romidepsin and RomiCabo treatments. The IC50 of RomiCabo is shown, all others are included in Supplementary Table 2 (p values in Supplementary Data 23). Unpaired t-test corrected with Benjamini-Hochberg, stars compare Romi versus RomiCabo (red and blue: 0.68 µM and 1.3 µM cabozantinib, respectively; n ≥ 4 independent biological experiments). Tumoroid viability upon cabozantinib alone is reported in Fig. S26a. b Protocol followed for in vivo study in Alb-R26Met mice. ∅ indicate lesions of a mouse that died during “drug holiday”. The scheme was performed with free open source (pngegg.com). c Examples of PC-CT imaged tumours, with 3D reconstruction, before and after treatment: responding (left) and non-responding (right). Red squares: high magnification tumours. d, e Left: percentage of tumours according to their behaviour (evolutive, quiescent, regressive). Right: ratio between final versus initial tumour volume (logarithmic scale). NT: non-treated tumours. Tumours are considered regressive if this ratio is less than 0.85, evolutive if greater than 1.15, and quiescent between these two thresholds. Unpaired two-tailed Mann-Whitney (d: p = 0.0013; e: p = 0.0041); number of independent samples is indicated. f Left: Sankey diagram represents lesions’ longitudinal behaviour at the end of the first session, of the “drug holiday”, and of the second session. Right: Ratio between final versus initial tumour volume (logarithmic scale) at the same time points as Sankey diagram. Unpaired two-tailed Mann-Whitney, p = 0.0061 (break) and p = 0.0025 (2nd session), number of independent samples indicated in b, d, e. g–l Expression levels of class-I Hdacs (g), Rad23b (h), Mki-67, Ccnd1 (CyclinD1), Xiap, Survivin (i), Srebf1, Mlxipl (j), Fasn, Scd1, Cd36 (k), Pd1, Pdl1 (l) in Alb-R26Met non-treated (NT) versus RomiCabo treated (R + C) tumours. RT-qPCR (as RQ) relative to NT tumours. g–l Unpaired two-tailed Mann-Whitney, exact p values are indicated (n ≥ 4 independent samples). Levels of significance: *p ≤ 0.05; **p ≤ 0.01; ***p ≤ 0.001. Bars represent SEM and notches in dot-plots represent mean levels. Source data are provided as a Source Data file.
Fig. 8
Fig. 8. Remodelling of the immune landscape in Alb-R26Met tumours upon RomiCabo treatment.
a Dot plot reporting the percentage of CD45+ cells among total live single cells in the Alb-R26Met non-treated (NT) and RomiCabo-treated tumours. A dedicated antibody panel (Supplementary Data 19) was used to quantify the immune cell infiltration by spectral flow cytometry, and a representative gate strategy to identify immune cell population is detailed in Fig. S28). b, c Uniform Manifold Approximation and Projection (UMAP) of immune cell clusters in Alb-R26Met tumours, with clusters overlay of indicated immune cells in the legend (b) and as density of cells (c) in non-treated (NT) and RomiCabo-treated Alb-R26Met tumours. T lymphocytes (TL: CD4+ and CD8+), B lymphocytes (BL), Natural Killer TL (NK-TL) cells, NK cells, neutrophils, monocytes, macrophages, conventional Dendritic Cells (cDC1 and cDC2), monocyte-derived DC (MoDC), and plasmacytoid DCs (pDC). d Pie-chart representing the percentages of distinct immune cell types in non-treated and RomiCabo-treated tumours, based on their marker identification with the antibody panel. e Dot-plots comparing the percentage of neutrophils, macrophages, monocytes, MoDC (top), B lymphocyte, TL-CD4+ , TL-CD8+, NKT (bottom), among CD45+ population, in non-treated (NT) and RomiCabo-treated tumours. f Dot-plots reporting median fluorescence intensity (MFI) of MHC-II in MoDC (top) and cDC2 (bottom), among CD45+ population, in non-treated (NT) and RomiCabo-treated tumours. g–i Dot plot reporting the percentage and the MFI of PD1 or CD44 in the indicated immune cell types. j–l Dot-plots showing the mRNA expression levels of the reported immune-checkpoints in Alb-R26Met non-treated (NT) and RomiCabo-treated (R + C) bulk tumours. RT-qPCR values are expressed as RQ, relative to non-treated tumours. Statistical analysis was performed with unpaired two-tailed Mann-Whitney, exact p values are indicated, at least 10 (a–i) or 4 (j–l) independent samples were used. Bars represent SEM, and notches in dot-plots represent mean levels. Source data are provided as a Source Data file.
Fig. 9
Fig. 9. Effect of RomiCabo treatment on the maturation profile of LPS-activated human MoDCs.
a Scheme illustrating the strategy employed to generate and stimulate MoDCs from human peripheral blood mononuclear cells (PBMCs) of healthy donors. After differentiation, immature MoDCs were kept non-treated (NT), activated with LPS without or with conditioned medium for 18 h. Conditioned medium were obtained from Huh7 cells either non-treated (NT) or treated with RomiCabo for 24 h. Scheme was performed with public open source Servier Medical Art, licensed under CC BY 4.0. Gate strategy for MoDC analysis is detailed in Supplementary Fig. S29. b Histograms show a representative flow cytometry profile of the expression of CD80, CD86, or HLA-DR (MHC-II) molecules at the surface of MoDCs non-treated (NT, black), treated with LPS alone (LPS; red), or treated with LPS plus the indicated conditioned medium (LPS+Sup; blue). c, d Quantification of the median fluorescence intensity (MFI) of CD80, CD86, and HLA-DR (MHC-II; c), and the percentage of CD80 and CD86 positive cells (d) obtained by flow cytometry. MFI of CD80 and CD86 was corrected by fluorescent minus two (minus CD80 and CD86 antibodies). Each dot represents a distinct donor of MoDC. Statistical differences were assessed using Friedman one-way repeated measure analysis of variance by ranks, followed by Dunn’s multiple comparison test. Exact p values are as follows: CD80 (c: p < 0.0001; d: p < 0.0017), CD86 (c: p = 0.0006; d: p = 0.0017), HLA-DR (c: p = 0.0003). *p ≤ 0.05; **p ≤ 0.01. Source data are provided as a Source Data file.
Fig. 10
Fig. 10. Scheme summarizing the effect of romidepsin alone or in combination with cabozantinib.
Romidepsin (Romi): 1 perturbs cell cycle signals and reduces cell survival regulators, 2 alters lipid metabolism modulators, and 3 causes defects in the mitotic machinery. Collectively, these events lead to a cytostatic effect and confer HCC cells dependency on RTK signalling support, which is an exploitable vulnerability. Consequently, the combination of romidepsin with RTKi (indicated here with cabozantinib; Cabo) leads to cytotoxic effects. Moreover, RomiCabo induces an immune infiltration and a switch towards an immune stimulatory profile, contributing to tumours regression. NT: non-treated cells. Scheme was performed with public open source Servier Medical Art, licensed under CC BY 4.0. Source data are provided as a Source Data file.

References

    1. Yu, X. et al. Cancer epigenetics: from laboratory studies and clinical trials to precision medicine. Cell Death Discov.10, 28 (2024). - PMC - PubMed
    1. Fernandez-Barrena, M. G., Arechederra, M., Colyn, L., Berasain, C. & Avila, M. A. Epigenetics in hepatocellular carcinoma development and therapy: The tip of the iceberg. JHEP Rep.2, 100167 (2020). - PMC - PubMed
    1. Haberland, M., Montgomery, R. L. & Olson, E. N. The many roles of histone deacetylases in development and physiology: implications for disease and therapy. Nat. Rev. Genet10, 32–42 (2009). - PMC - PubMed
    1. Du, G., Yang, R., Qiu, J. & Xia, J. Multifaceted influence of histone deacetylases on dna damage repair: Implications for hepatocellular carcinoma. J. Clin. Transl. Hepatol.11, 231–243 (2023). - PMC - PubMed
    1. Yang, F. F., Hu, T., Liu, J. Q., Yu, X. Q. & Ma, L. Y. Histone deacetylases (HDACs) as the promising immunotherapeutic targets for hematologic cancer treatment. Eur. J. Med Chem.245, 114920 (2023). - PubMed

MeSH terms