. 2025 Aug 25;16(1):7924.
doi: 10.1038/s41467-025-63276-7.

Fishing out AIEC with FimH capturing microgels for inflammatory bowel disease treatment

Affiliations

Fishing out AIEC with FimH capturing microgels for inflammatory bowel disease treatment

Jialin Wu et al. Nat Commun. .

Abstract

Inflammatory bowel disease (IBD) is a chronic immune-mediated condition with rising global incidence and limited treatment options. Current therapies often have poor efficacy and undesirable side effects. Here we present a drug-free strategy that targets bacterial adhesion to manage IBD. We develop porous microgels loaded with mannan oligosaccharides (MOS) that mimic the natural binding sites of intestinal cells. These microgels attract adherent-invasive Escherichia coli (AIEC) by interacting with FimH, a bacterial protein used for attachment, thereby preventing AIEC from colonizing the gut lining. The microgels are fabricated using an all-aqueous two-phase system, enabling biocompatibility and structural control. In a mouse model of IBD, this competitive adsorption approach alleviates intestinal inflammation, reduces harmful Enterobacteriaceae, and enhances gut microbial diversity. This work introduces a non-antibiotic, bioinspired method that intercepts pathogenic bacteria and restores microbial balance, offering a promising therapeutic strategy for IBD.


Conflict of interest statement

Competing interests: The authors have thoroughly reviewed the journal’s policy on Competing Interests and declare that they have no competing interests related to this research.

Figures

Fig. 1
Fig. 1. Schematic overview of porous MOS microgels for IBD treatment.
Schematic illustration of porous MOS MGs fabrication by merging all-aqueous and co-axial microfluidic technologies and prompting microgels competitively absorbing AIEC over intestinal epithelial cells for the treatment of IBD by leveraging the binding properties of FimH with mannose.
Fig. 2
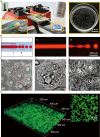
Fig. 2. The fabrication of porous MOS MGs by all-aqueous co-axial microfluidics.
A Images of the equipment to generate porous microgels. B Schematic illustration and corresponding fluorescence microscopy images of the fabrication procedure of the fibers (I) and microspheres (II). C, D Bright-field microscopy images of MOS MGs. (n = 3 biological replicates). E SEM image of MOS MGs. (n = 3 biological replicates). F Confocal Z-axis scanning images of MOS MGs cross-sections. Source data are provided as a Source Data file.
Fig. 3
Fig. 3. Cellular behaviors and stability of MOS MGs.
A, B Biocompatibility assessment of MOS MGs using Caco-2 cells: Live/Dead cell staining (A) and CCK-8 assay (n = 3) (B). C Growth curve of AIEC in LB medium with or without the addition of MOS MGs (n = 3). D Growth curves of AIEC under conditions where MOS, MGs, and MOS MGs serve as the only carbon sources (n = 3). E UV-Vis spectroscopy analysis of MOS release into the solution (n = 3 biological replicates). FH Bright-field microscopy images of MOS MGs immersed for 48 h in PBS, SGF, and SIF. Significance was determined by one-way ANOVA and indicated as the P-value (B, E). * P < 0.05, ** P < 0.01, *** P < 0.001, **** P < 0.0001; n.s. no significant difference. Data are presented as mean ± s.d. (B, E). Source data are provided as a Source Data file.
Fig. 4
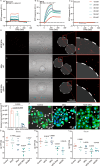
Fig. 4. MOS MGs block AIEC adhesion to intestinal epithelial cells by binding with FimH.
AC The purified FimH protein was subjected to SPR experiments to detect its molecular interaction with mannose (A), MOS (B), and glucose (C). D Confocal images of MOS MGs (I) and MGs (II) co-cultured with AIEC, as well as confocal images of MOS MGs co-cultured with ΔfimH (III). E Competitive adhesion assay of AIEC between MOS MGs and Caco-2 cells, visualized by colony-forming unit (CFU) plating (n = 3 biological replicates). F Confocal imaging of competitive adhesion of AIEC between MOS MGs and Caco-2 cells. Red: AIEC; blue: DAPI-stained nuclei; green: Calcein-AM-stained cells; white arrows indicate AIEC. GI Colonization levels of WT in feces (G), colon (H), and ileum (I) at 48 hours post-treatment with MOS, MGs, MOS MGs, and M4284. (n = 6). Significance was determined by one-way ANOVA (E) or two-sided Mann‒Whitney U test (GI) and indicated as the P-value. * P < 0.05, ** P < 0.01, *** P < 0.001, **** P < 0.0001; n.s. no significant difference. Data are presented as mean ± s.d. (E). Source data are provided as a Source Data file.
Fig. 5
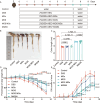
Fig. 5. Excellent therapeutic efficacy of MOS MGs in the mice model with DSS-induced colitis.
A Schematic illustration of model building and intervention. B Macroscopic colon appearance of each group was shown. C Colon length was measured and analyzed (n = 6). D Daily changes in body weight were recorded in detail and analyzed (n = 6). E Daily DAI scores were calculated and analyzed (n = 6). Significance was determined by one-way ANOVA (C), two-way ANOVA (D, E) and indicated as the P-value. Data are presented as mean ± s.d. (C, D, E). (n = 6 biological replicates). Each replicate represents data from an individual mouse. Source data are provided as a Source Data file.
Fig. 6
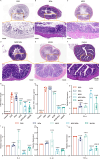
Fig. 6. MOS MGs inhibit intestinal inflammation and prompt tissue repair.
AF Representative hematoxylin and eosin (H&E) staining images of colon tissue of each group. G Colonic damage scores according to H&E staining were analyzed in each group (n = 6 biological replicates). Each replicate represents data from an individual mouse. H Intestinal permeability assessment using FITC-dextran (n = 3 biological replicates). Each replicate represents data from an individual mouse. IL Colonic mRNA levels of ZO-1, IL-6, IL-1β, and TNF-α, (n = 3 biological replicates). Significance was determined by one-way ANOVA (GL) and indicated as the P-value; ns, not significant; * p < 0.05, ** p < 0.01, *** p < 0.001, **** p < 0.0001. Data are presented as mean ± s.d. Source data are provided as a Source Data file.
Fig. 7
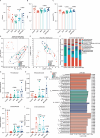
Fig. 7. MOS MGs modulate of gut microbiome.
AC Shannon index (A), chao index (B), observed OTUs (C) of gut microbiota in mice after different treatments. OTUs operational taxonomic units. D Principal coordinate analysis (PCoA) using Bray-Curtis metric distances of beta diversity. Samples are colored based on treatment conditions. Each point represents a sample, with distances indicating the degree of dissimilarity between communities. PC1 and PC2 explain 43.07% and 13.32% of the variance, respectively. Bray-Curtis dissimilarities were calculated and subjected to classical multidimensional scaling for ordination. Significant differences between groups were assessed using PERMANOVA (permutational multivariate analysis of variance), performed as a two-sided test with 999 permutations (p < 0.05). E PLS-DA Analysis of 16S rRNA Sequencing Data. PLS-DA was performed to assess the differences in microbial community composition among samples grouped by treatment conditions. Each point represents a sample, and the clusters indicate significant differences in microbial communities. Partial least squares discriminant analysis was used as a supervised multivariate method. Statistical significance was evaluated using two-sided permutation tests (n = 1000 permutations). (p < 0.05). F Community barplot analysis of microbial composition. Barplots illustrate the relative abundance of microbial taxa across different samples, grouped by treatment conditions. Taxa are represented at the genus level, with colors indicating different taxonomic groups. Each bar represents the relative abundance of different taxa, with the total height indicating overall community composition. Relative abundance of Enterobacteriaceae (G), Prevotellaceae (H), Lactobacillaceae (I) and Bifidobacteriaceae (J) at family-level taxonomy after different treatments. K Taxa listed according to their LDA values determined from comparisons between the five groups using the LEfSe method. LDA (log10)  >  4.0, P  <  0.05 indicates a higher relative abundance in the corresponding group than in other groups. Statistical analysis was conducted using the LEfSe pipeline, which includes a two-sided non-parametric Kruskal–Wallis test to detect taxa with significant differences among groups, followed by an unpaired Wilcoxon rank-sum test to assess subclass consistency, and linear discriminant analysis (LDA) to estimate the effect size. No adjustment for multiple comparisons was applied. The number of samples is n = 6. Data are presented as mean ± s.d. Source data are provided as a Source Data file.

References

    1. Dreux, N. et al. Point mutations in FimH adhesin of Crohn’s disease-associated adherent-invasive Escherichia coli enhance intestinal inflammatory response. PLoS Pathog.9, e1003141 (2013). - PMC - PubMed
    1. Stower, H. Common IBD pathogenic mechanisms. Nat. Med.26, 21–21 (2020). - PubMed
    1. Mak, J. W. Y. et al. Development of the global inflammatory bowel disease visualization of epidemiology studies in the 21st century (GIVES-21). BMC Med. Res. Methodol.23, 129 (2023). - PMC - PubMed
    1. Torres, J., Mehandru, S., Colombel, J.-F. & Peyrin-Biroulet, L. Crohn’s disease. Lancet389, 1741–1755 (2017). - PubMed
    1. Ungaro, R., Mehandru, S., Allen, P. B., Peyrin-Biroulet, L. & Colombel, J.-F. Ulcerative colitis. Lancet389, 1756–1770 (2017). - PMC - PubMed

MeSH terms

LinkOut - more resources