. 2025 Aug 25;16(1):7900.
doi: 10.1038/s41467-025-63183-x.

Modeling of T cell-mediated autoimmune pituitary disease using human induced pluripotent stem cell-originated organoid

Affiliations

Modeling of T cell-mediated autoimmune pituitary disease using human induced pluripotent stem cell-originated organoid

Keitaro Kanie et al. Nat Commun. .

Abstract

Anti-pituitary-specific transcription factor (PIT)-1 hypophysitis is an autoimmune disease characterized by hormone secretion impairment from PIT-1-expressing pituitary cells, accompanied by malignancies with ectopic PIT-1 expression. Cytotoxic T cells (CTL) targeting PIT-1-positive cells have been implicated in disease development, yet direct evidence is lacking. As human leukocyte antigen (HLA)-matching is required for modeling T cell-mediated autoimmune diseases, we employ induced pluripotent stem cells (iPSC) to generate pituitary organoids harboring the patients' HLA haplotype and coculture the organoids with PIT-1-reactive CTLs isolated from the patients' peripheral blood mononuclear cells. The coculture demonstrates specific CTL-mediated cytotoxicity against PIT-1-positive cells exclusively in autologous conditions, with this cytotoxicity inhibited by immunosuppressive agents such as dexamethasone and cyclosporin A. Multiple combinations of epitopes, CTLs, and HLA molecules are responsible for pathogenesis. These data demonstrate CTL-mediated autoimmunity in anti-PIT-1 hypophysitis and highlight the potential application of this strategy for other T cell-mediated autoimmune diseases.


Conflict of interest statement

Competing interests: Yutaka Takahashi has received research funding from Teijin Pharma Co., Ltd. and Ono Pharma Co., Ltd. Shin Kaneko is a founder, shareholder, and director of Thyas Co., Ltd. and has received research funding from Takeda Pharmaceutical Co., Ltd., Astellas Co., Ltd., Kirin Co., Ltd., Terumo Co., Ltd., and Thyas Co., Ltd. The other authors have nothing to declare.

Figures
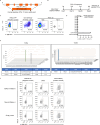
Fig. 1
Fig. 1. Cloning of specific cytotoxic T lymphocytes (CTLs) from a patient with anti-PIT-1 hypophysitis (Case 1).
a Design of overlapping peptides (OPs) for covering PIT-1. The amino acid sequence translated from the open reading frame of PIT-1 was used to design OPs. b Schematic of peptide pool (PP) exposure and isolation of reactive CTLs from peripheral blood mononuclear cells (PBMCs). CD4+CD25+ depleted PBMCs were prepared on day 0. PP21-30 was exposed to the CD4+CD25+ depleted PBMCs every 14 days. After four repeated exposures, the reactivity of CTLs was confirmed based on 4-1BB expression upon re-exposure to PP21-30. c Isolation of PP21-30 reactive CTLs on the basis of the Vβ-subtype. The 4-1BB expression was evaluated 24 h after PP21-30 exposure. Anti-CD3 antibody was used as positive control. All data were gated on live cells. Gating on Vβ7.1+ was added only for the rightmost panel. d Determination of reactive OPs from PP21-30. The 4-1BB+ proportion on Vβ7.1+ CTLs was evaluated 24 h after each OP exposure, and the ratio of 4-1BB+ cells on Vβ7.1+ CTLs is shown; the original flow cytometry panels appear in Supplementary Fig. 1e. OP30 is indicated with an arrow, and its amino acid sequence is provided. Source data are provided as a Source Data file. e TCR repertoire analysis of OP30-reactive Vβ7.1+ CTLs. Next-generation sequencing (NGS) was applied for the analysis. Source data are provided as a Source Data file. f Flow cytometry analysis for OP30-reactivity of PB-CTLs with TCR-expressing vector transduction. The lentivirus vectors shown in Supplementary Fig. 2f were used for the transduction. The 4-1BB expression was evaluated 24 h after OP30 exposure. The anti-CD3 antibody was used as positive control. Representative data from five independent experiments are shown. All data were gated on CD8+CD45+ live cells.
Fig. 2
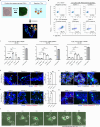
Fig. 2. Regenerating functional PIT-1-expressing pituitary cells from patient-derived induced pluripotent stem cells (iPSCs).
a Schematic presentation of pituitary cell differentiation from human iPSCs using SFEBq culture (serum-free floating culture of embryoid body-like aggregates with quick reaggregation). The outer layer cells differentiate into pituitary cells. b Immunofluorescence of LHX3 (pituitary progenitor cell marker), Nkx2.1 (hypothalamic cell marker), and E-cadherin (pituitary progenitor cell marker) at day 39 (upper panels) and PIT-1 and E-cadherin at day 100 (lower panels) for iPSC-derived pituitary cells. c The schematic of GFP knock-in targeting the human PIT-1 locus. The GFP cassettes were inserted directly under the stop codon of the PIT-1 locus. The RFP and Puro cassettes were sandwiched between loxP (arrowheads) and insulator sequences (hexagons). d Phase contrast and GFP images of differentiated pituitary cells at day 100. GFP+ cells localize to the outer layer of cell organoids, in which pituitary progenitor cells reside. Scale bars: 200 µm. e Immunofluorescence of hoechst, PIT-1, and GFP. Scale bars: 50 µm. f Immunofluorescence of hoechst, PIT-1, and GH. Scale bars: 50 µm. g The proportion of GH+ cells in PIT-1+ cells was calculated in immunofluorescent images in (f). Ordinary one-way analysis of variance followed by Tukey’s multiple comparisons test was used for statistical analysis. Data are presented as the mean ± standard deviation (SD). Each dot shows technical replicates from different experiments (n = 7). Source data are provided as a Source Data file. h The GH concentration in culture supernatant of each pituitary cell organoid was measured before and after 24 h of GHRH stimulation. Each dot shows technical replicates from the same pituitary organoid batches (n = 4). The two-sided Mann–Whitney U test was used to compare the differences in GH concentration in pre- and post-stimulated organoids. *P = 0.0286. Data are presented as the mean ± SD. Representative data from two independent experiments are shown. Source data are provided as a Source Data file.
Fig. 3
Fig. 3. Disease modeling in Case 1: Coculturing iPSC-derived pituitary organoids and reactive CTLs.
OP30-reactive CTLs from Case 1 were cocultured with iPSC-derived pituitary organoids for 48 h (ag). Vβ7.1+ CTLs (e, g) and TCR-transduced CTLs with the TRAV16/TRBV4-1 pair (bd, f) were used as OP30-reactive CTLs. a Schematic overview of coculture experiments. b Flow cytometry analysis regarding the reactivity of CTLs against iPSC-derived pituitary cells. The 4-1BB expression on CTLs was evaluated 48 h after coculture. The anti-CD3 antibody was used as positive control. Representative data of two independent experiments are shown. All data were gated on Kusabira-Orange+ live cells. c qRT-PCR analysis of the expression of GZMB, IFNG, and PRF1 (n = 3). Total RNA was extracted from cells after coculturing. ACTB was used as an internal control. Ordinary one-way analysis of variance (ANOVA) followed by Dunnett’s multiple comparison tests was used for statistical analysis. ***P = 0.0001 (Case 1), and ***P = 0.0007 (Case 1 GFP+), compared with Control 1; ###P = 0.0001 (Case 1), ###P = 0.0007 (Case 1 GFP), compared with Control 2 (IFNG). ***P = 0.0001 (Case 1), and ***P = 0.0007 (Case 1 GFP+), compared with Control 1; ###P = 0.0001 (Case 1), ###P = 0.0007 (Case 1 GFP), compared with Control 2 (IFNG). ****P = 0.0001 >, compared with Control 1; ####P = 0.0001 >, compared with Control 2 (GZMB). ***P = 0.0003 (Case 1), and ****P = 0.0001 > (Case 1 GFP+), compared with Control 1; ####P = 0.0001 >, compared with Control 2 (PRF1). Data are presented as the mean ± SD. Representative data from three independent experiments are shown. Source data are provided as a Source Data file. dg Immunofluorescence images of pituitary organoids after 48 h of coculture. Double staining of CD8 and PIT-1 (d, e) and cleaved caspase-3 (CC3) and PIT-1 (f, g) are shown. E-cadherin was also stained in (e). The number of CD8-positive cells within 30 μm from PIT-1-positive (d) and CC3-positive (f) cells were quantified. Each dot shows technical replicates from the identical coculture experiments (n = 3). Ordinary one-way ANOVA followed by Dunnett’s multiple comparisons test was used for statistical analysis. Scale bars: 50 µm. **P = 0.0048 (d) and **P = 0.0024 (f). Data are presented as the mean ± SD. Representative data from two independent experiments are shown. Source data are provided as a Source Data file (d, f). h Time-lapse imaging of a coculture experiment. The GFP signal from the FITC channel was overlaid on bright field images. Nonstained cells are TCR-transduced CTLs using the TRAV16/TRBV4-1 pair. PIT-1+ cells were distinguished through GFP expression. Scale bars: 30 µm. The images from a single experiment are shown.
Fig. 4
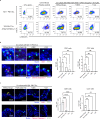
Fig. 4. HLA-A24 restriction for OP30-reactive CTLs from Case 1.
a, b Flow cytometry analysis regarding the reactivity of CTLs against OP30 in an HLA-A24-restricted manner. The 4-1BB expression on OP30-reactive CTLs was evaluated 24 h after coculture with K562 cells. a Data from Vβ7.1+ CTLs. Representative data from four independent experiments are shown. All data were gated on CD3+CD45+ live cells. b Data from TCR-transduced CTLs using the TRAV16/TRBV4-1 pair. Representative data from three independent experiments are shown. All data were gated on CD45+ live cells. c Flow cytometry analysis with OP30-loaded HLA-A24 tetramer. Representative data from two independent experiments are shown for bulk PB-CTLs and Vβ7.1+ CTLs. Data from a single experiment are shown for TCR-PB-CTLs. All data were gated on CD4-CD8+ live cells. Flow cytometry analysis regarding the effect of HLA-class I blocking on the activation of Vβ7.1+ CTLs (d) and TCR-transduced PB-CTLs (TRAV16/TRBV4-1) (e). OP30 and HLA-A24 expressing K562 cells were utilized for CTL activation. CTLs were cultured for 24 h in the presence of different concentrations of HLA-class I antibody. The 4-1BB expression on CTLs was evaluated. All data were gated on CD3+CD8+ live cells. Representative data from three independent experiments for Vβ7.1+ CTLs, and data from a single experiment for TCR-transduced PB-CTLs (TRAV16/TRBV4-1) are shown.
Fig. 5
Fig. 5. Treatment screening model for anti-PIT-1 hypophysitis.
a Flow cytometry analysis regarding the inhibitory effects of drugs on CTL activation. CTLs were cocultured with K562 cells in the presence of high-dose OP30 (10 µg/mL = 28.4 µM). Data were acquired 24 h after coculture. All data were gated on CD3+CD45+ live cells. Representative data from four independent experiments for Vβ7.1+ CTLs, and from two independent experiments for TCR-transduced CTLs using the TRAV16/TRBV4-1 pair are shown. The effect of drugs on the migration and cytotoxicity of Vβ7.1+ CTLs from Case 1 (b) and Vβ8+ CTLs from Case 2 (c). Immunofluorescence images of pituitary organoids after 48 h of autologous coculture are shown (n = 4). Double staining of CD8 and PIT-1 is shown on the upper row and cleaved caspase-3 (CC3) and PIT-1 on the lower row. CD8-positive cells within 30 μm from PIT-1-positive and CC3-positive cells were counted. Scale bars for (b) and (c) are 30 µm and 50 µm, respectively. Each dot shows technical replicates from the identical coculture experiments (n = 4). Ordinary one-way analysis of variance followed by Dunnett’s multiple comparisons test was used for statistical analysis. ****P = 0.0001 > for CD8+ cells, and *P = 0.0126 and **P = 0.022 for CC3+ cells in (b). **P = 0.0028 (Without drugs vs. HLA-class I Ab) and **P = 0.0013 (Without drugs vs. Dex, and Without drugs vs. CiA) for CD8+ cells, and *P = 0.0126 and **P = 0.022 for CC3+ cells in (c). Data are presented as the mean ± SD. Representative data from three independent experiments for (b) and two independent experiments for (c) are shown. Source data are provided as a Source Data file (b, c).

References

    1. Yamamoto, M. et al. Autoimmune pituitary disease: new concepts with clinical implications. Endocr. Rev.41, bnz003 (2020). - PubMed
    1. Takahashi, Y. Mechanisms in endocrinology: autoimmune hypopituitarism: novel mechanistic insights. Eur. J. Endocrinol.182, R59–r66 (2020). - PubMed
    1. Bando, H. et al. Paraneoplastic autoimmune hypophysitis: an emerging concept. Best. Pract. Res. Clin. Endocrinol. Metab.36, 101601 (2021). - PubMed
    1. Yamamoto, M. et al. Adult combined GH, prolactin, and TSH deficiency associated with circulating PIT-1 antibody in humans. J. Clin. Invest.121, 113–119 (2011). - PMC - PubMed
    1. Bando, H. et al. Involvement of PIT-1-reactive cytotoxic T lymphocytes in anti-PIT-1 antibody syndrome. J. Clin. Endocrinol. Metab.99, E1744–E1749 (2014). - PubMed

MeSH terms