. 2025 Aug;57(8):1861-1877.
doi: 10.1038/s12276-025-01521-1. Epub 2025 Aug 25.

Mitochondrial-encoded peptide MOTS-c prevents pancreatic islet cell senescence to delay diabetes

Affiliations

Mitochondrial-encoded peptide MOTS-c prevents pancreatic islet cell senescence to delay diabetes

Byung Soo Kong et al. Exp Mol Med. 2025 Aug.

Abstract

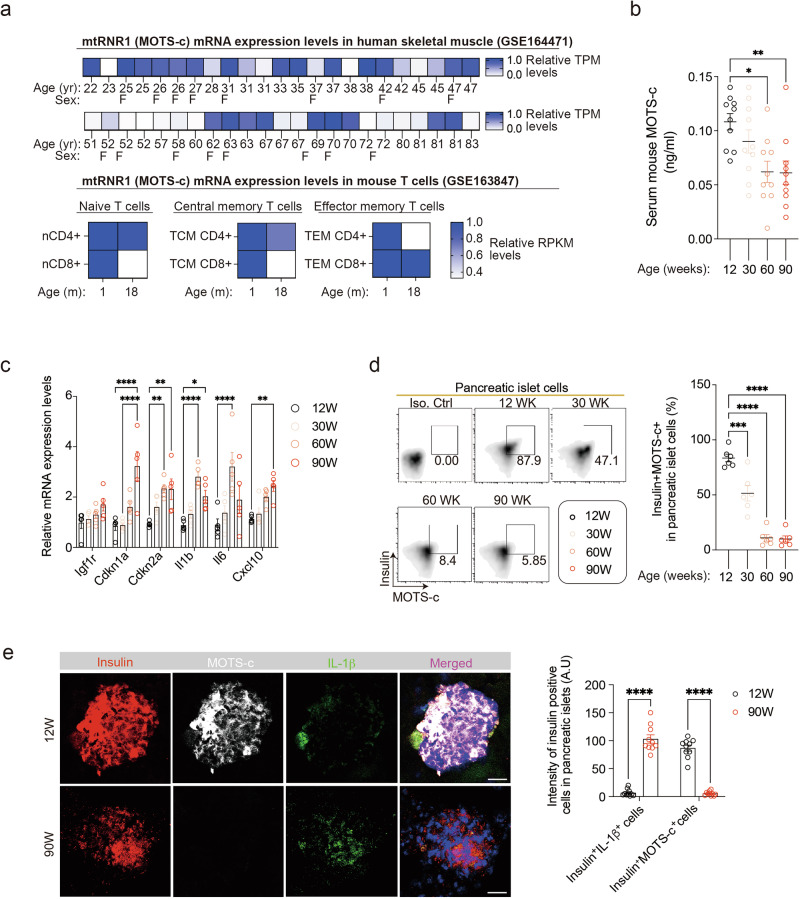
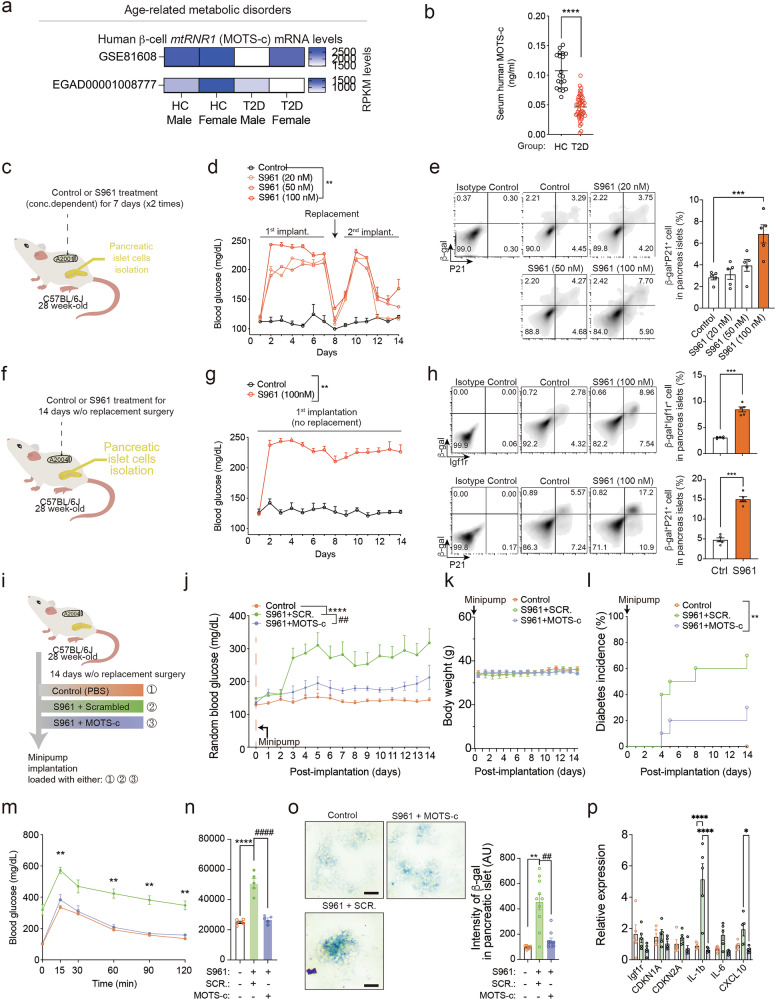
Mitochondria are crucial for cell survival and function, partly through peptides encoded by the mitochondrial genome. Although mitochondrial dysfunction is a hallmark of age-related diseases and senescence, the role of mitochondrial-genome-encoded peptides in pancreatic β-cell senescence during type 1 and type 2 diabetes pathogenesis is largely unexplored. Here we show that MOTS-c levels decrease with aging and senescence in pancreatic islet cells. Treating aged C57BL/6 mouse pancreatic islets with MOTS-c reduced pancreatic islet senescence by modulating nuclear gene expression and metabolites involved in β-cell senescence. MOTS-c treatment improved pancreatic islet senescence and glucose intolerance in S961-treated C57BL/6 and in nonobese diabetic mice. In humans, circulating MOTS-c levels are lower in type 2 diabetes patients compared with healthy controls. Our findings suggest that mitochondrial-encoded MOTS-c regulate pancreatic islet cell senescence and that MOTS-c could act as a senotherapeutic agent to prevent pancreatic islet cell senescence and diabetes progression.


Conflict of interest statement

Competing interests: The authors declare no competing interests.

Figures

Fig. 1
Fig. 1. MOTS-c declines with chronological aging in β-cells.
a mtRNR1 mRNA expression levels were analyzed using publicly available datasets (GSE164471, GSE163847) (Supplementary Table 4). Skeletal muscle transcriptome data (relative Transcripts per million, TPM, levels) from healthy individuals of varying ages (22–83 years) and sex (blank, male; F, female) were obtained from GSE164471. Mouse CD4+ and CD8+ T cell (naive, central memory and effector memory T cells) transcriptome data (relative TPM levels) from mice aged either 1 or 18 months were obtained from GSE163847 (Supplementary Table 4). In addition, mouse serum and pancreatic islet cells were isolated from C57BL/6 mice aged 12, 30, 60 and 90 weeks for various analyses, including MOTS-c ELISA, qPCR, immunofluorescence (IF) staining and flow-cytometry. b Using MOTS-c ELISA, serum MOTS-c levels were measured. MOTS-c levels decreased with age in 60- and 90-week-old C57BL/6 mice compared with 12-week-old mice (n = 10 per group; one-way ANOVA; error bars are the s.e.m.). *P < 0.01, **P < 0.05. c qPCR analysis was performed to compare mRNA levels of Igf1r, Cdkn1a, Cdkn2a, Il-1b, Il-6 and Cxcl10 in pancreatic islet cells isolated from mice aged 12, 30, 60 and 90 weeks (two-way ANOVA; the error bars are the s.e.m.). *P < 0.05, **P < 0.01, ****P < 0.0001. d Flow-cytometry was employed to compare intracellular MOTS-c and insulin in pancreatic β-cells isolated from 12- and 90-week-old mice (one-way ANOVA; the error bars are the s.e.m.). ****P < 0.0001. e IF staining of MOTS-c in insulin-positive pancreatic β-cells showed higher expression of MOTS-c in 12-week-old β-cells compared with 90-week-old β-cells. IL-1β-expressing β-cells were more prevalent in 90-week-old mice than in 12-week-old mice. The pancreatic sections were prepared as described; the representative data are from ten pancreas sections for each group (n = 10 per group). Scale bars, 50 μm; two-way ANOVA; the error bars are the s.e.m. ****P < 0.0001.
Fig. 2
Fig. 2. Systemic MOTS-c treatment prevents β-cell senescence and pancreatic insulitis in NOD mice.
a The publicly available datasets were analyzed to assess mtRNR1 mRNA (GSE205853; fold change) and protein (PXD014244; fold change) levels in pancreatic β-cells or β-cell lines (EndoC-BH1 cells) with statistical significance indicated (*P < 0.05) (Supplementary Table 4). The 5-week-old NOD mice (n = 20 per group) were acquired and maintained for 2 weeks. The 7-week-old NOD mice were treated either with scrambled peptide (SCR), MOTS-c (M, 0.5 mg kg−1 per day, i.p.), exendin-4 (E, 2.0 µg kg−1, two times a day, i.p.) or both peptides (E + M) until 18 weeks of age (Supplementary Fig. 2a). b,c NOD mice were monitored for blood glucose levels (b) and body weight (c). d An IPGTT was performed at 14-weeks of age, and area under the curve (AUC) was analyzed. e After sacrifice, H&E staining was conducted in NOD pancreas sections to evaluate pancreatic insulitis in NOD mice treated with either scrambled, MOTS-c, exendin-4 or both. The pancreatic sections were prepared as described and representative data are from five pancreas sections per group are shown. Scale bars, 50 μm; repeated measures two-way ANOVA or two-way ANOVA; error bars are the s.e.m. f At 18 weeks, NOD pancreatic islet cells were isolated for immunofluorescence staining of insulin and γ-H2AX. The pancreatic sections were prepared as described and representative data are from ten pancreas with two sections for each group. Scale bars, 50 μm; two-way ANOVA; the error bars are the s.e.m. g The pancreatic islets from each group were assessed by qPCR analysis on Igf1r, Cdkn1a, Cdkn2a, Il-1b, Il-6 and Cxcl10. Two-way ANOVA; error bars are the s.e.m. h Flow cytometry was conducted on β-gal and P21 in 18-week-old NOD pancreatic islet cells from each group. i For metabolic flux analyses (Fig. 5i and Supplementary Fig. 2c), 18-week-old NOD pancreatic islet cells from each group were assessed for (Supplementary Fig. 2c) glycolysis after glucose stimulation (n = 5) and respiratory capacity (n = 5); two-tailed t-test; the error bars represent the s.e.m. *P < 0.05, **P < 0.01, ****P < 0.0001. Seahorse measurement was normalized by using total cell number (BioTek Citation 1/5). One-way ANOVA; error bars are the s.e.m. ***P < 0.001, ****P < 0.0001 for comparison between scrambled and MOTS-c. P < 0.05 for comparison between scrambled versus exendin-4 or exendin-4 versus exendin-4 + MOTS-c. j NOD-β-cell-derived NIT-1 cells (n = 10 cells per slide, n = 5 slides per group) overexpressing either empty vector or MOTS-c were analyzed with TEM for mitochondria number and morphology. Two-tailed t-test; the error bars are the s.e.m. Scale bars, 1 μm. *P < 0.05, **P < 0.01, ****P < 0.0001 for comparison between scrambled and MOTS-c. #P < 0.05, ###P < 0.001 for comparison between scrambled versus exendin-4. ††P < 0.01, †††P < 0.001, ††††P < 0.0001 for comparison between scrambled versus MOTS-c + exendin-4.
Fig. 3
Fig. 3. Circulating and β-cell MOTS-c levels are low in patients with T2D, and systemic MOTS-c treatment prevents pancreatic islet senescence in S961-treated C57BL/6 mice.
a Publicly available datasets from patients with T2D and healthy control patients (GSE81608, EGA00001006273) were analyzed to evaluate mtRNR1 (MOTS-c) mRNA levels (RPKM levels) (Supplementary Table 4). b The serum samples from human patients with T2D (n = 45) and healthy controls (n = 19) were obtained and analyzed for circulating MOTS-c levels at fasting baseline. Two-tailed t-test; the error bars are the s.e.m. ****P < 0.0001. ce The insulin-receptor antagonist S961 or PBS (control) (n = 5 per group) was loaded in Alzet osmotic pump 2001, which was then implanted in 28-week-old C57BL/6 mice for 1 week. d After a week, replacement surgery was performed to change the osmotic pump for the second week; blood glucose levels were monitored throughout the 14-day period and after sacrifice, (e) β-gal+P21+ population in pancreatic islets (n = 5 per group) was analyzed. Two-way ANOVA; the error bars are the s.e.m. ***P < 0.001. f The insulin-receptor antagonist S961 or PBS (control) (n = 5 per group) was loaded in Alzet osmotic pump 2004, which was then implanted in 28-week-old C57BL/6 mice for 2 weeks without further replacement surgery. g,h The blood glucose levels were (g) monitored for the entire 14 days and after sacrifice, and (h) β-gal+Igf1r+ and β-gal+P21+ population in pancreatic islets (n = 5 per group) were analyzed. Two-way ANOVA; the error bars are the s.e.m. ***P < 0.001. i The insulin-receptor antagonist S961, along with either MOTS-c or scrambled peptide, was loaded into Alzet osmotic pump 2004 and implanted in 28-week-old C57BL/6 mice for 2 weeks. jo (j) Random blood glucose, (k) body weight, (l) diabetes incidence (m), IPGTT, (n) area under the curve (AUC), (o) and β-gal staining was performed after 2 weeks of S961 treatment. The pancreatic sections were prepared as described; representative data are from ten pancreas sections for each group (n = 10 per group). Scale bars, 50 μm. One-way, two-way or repeated measures two-way ANOVA; the error bars are the s.e.m. **P < 0.01, ****P < 0.0001 for comparison between control versus S961 + scrambled. ##P < 0.01, ####P < 0.0001 for comparison between S961 + scrambled versus S961 + MOTS-c. p The pancreatic islet cells were isolated from 28-week-old C57BL/6 mice treated in vivo with either PBS, S961 + scrambed or S961 + MOTS-c for 2 weeks. The pancreatic islet cells were then incubated in culture media to obtain ‘conditioned’ media. Fresh pancreatic islet cells were isolated from different mice and incubated with the ‘conditioned’ media for 24 h. Finally, the cells in conditioned media were collected and analyzed by qPCR on Cdkn1a, Cdkn2a, IL-1b and Cxcl10. Two-way ANOVA; the error bars are the s.e.m. *P < 0.05, **P < 0.01, ****P < 0.0001. i A diagram depicting the possible role of MOTS-c in β-cell senescence and SASP.
Fig. 4
Fig. 4. MOTS-c regulates genes associated with aspartate–glutamate transport to prevent senescence in pancreatic islet and Min6 cells.
a,b MOTS-c or scrambled ex vivo treatment (10 μM, 24 h) was applied to pancreatic islet cells isolated from four littermates of 60-week-old C57BL/6 mice (n = 2 per group) to analyze transcriptional changes; these changes were assessed using a PCA plot analyzed by using the scikit-learn Python package (a) and a hierarchical heat map (b). cf KEGG and GO analyses (adjusted P value <0.05) indicated that the affected genes are associated with metabolism, cellular communication and signaling and transport (c); analysis included: Gene Ontology: biological process (GO: BP) (d) Gene Ontology: cellular components (GO: CC) (e) Gene Ontology: molecular function (GO: MF) (f) were analyzed. g,h The upset plots were used to identify intersecting sets, which are commonly shared genes related to metabolism (pink), signaling (orange) and transport (green); these commonly shared genes, categorized as either upregulated (g) or downregulated (h) (blue), were displayed in a heat map. i, MOTS-c or scrambled ex vivo treatment (10 μM, 24 h) was applied to pancreatic islet cells isolated from littermates of 60-week-old C57BL/6 mice (n = 3 per group). j pLJM1-MOTS-c or pLJM1-empty vectors were overexpressed in Min6 cells. Then, cells were treated with or without hydrogen peroxide (200 μM, 24 h) for senescence induction. Subsequently, the expression of genes involved in aspartate–glutamate pathway (Mdh1, Mdh1b, Mdh2, Got1 and Got2), EphA5-ephrina5 genes and senescence-related genes (Cd38 and Grem1) were analyzed in both sets.
Fig. 5
Fig. 5. MOTS-c regulates metabolites associated with glutamate transport to prevent senescence in pancreatic islet cell and Min6 cells.
a,b Treatment with MOTS-c or scrambled control (10 μM, 24 h) and hydrogen peroxide (H2O2, 200 μM, 24 h) in pancreatic islet cells (pooled from two mice per sample) isolated from littermates of 60-week-old C57BL/6 mice (n = 3 per sample) led to metabolic changes, as shown in the PCA graph (a) and the heat map (b). c Enrichment analyses of metabolites were performed for control versus MOTS-c and for H2O2 versus H2O2 + MOTS-c. d A diagram depicting the enriched genes and metabolites analyzed in pancreatic islet cells treated with or without MOTS-c and H2O2 (200 μM, 24 h). e A Venn diagram analysis was performed to find shared pathways by comparing these two enrichment analyses. f Min6 cells overexpressing either empty vector or MOTS-c were treated with glutamine and the expression of genes Slc1a5, Slc1a5 variant, Gls1/2 and Cd38, and Cdkn1a and Cdkn2a were assessed. Two-way ANOVA; the error bars are the s.e.m. *P < 0.05, **P < 0.01 for difference between empty-vector transfected; ##P < 0.01 for difference between empty-vector transfected treated with 5 mM glutamine and MOTS-c transfected treated with 5 mM glutamine. g Min6 cells overexpressing either an empty vector or MOTS-c were analyzed for protein levels of IGF1R, P16, mito-MOTS-c, nuclear MOTS-c- and mTORC1-related molecules and Gls1 in the presence or absence of glutamine (5 mM), H2O2 (200 μM, 24 h) or both.
Fig. 6
Fig. 6. MOTS-c treatment prevents senescence in an mTORC1-dependent manner in pancreatic islet and Min6 cells.
a Publicly available datasets (GSE137027, GSE64553, GSE72815, GSE98440 and GSE102004) were analyzed for mtRNR1 (MOTS-c) mRNA expression levels (Supplementary Table 4). b To explore the underlying mechanism of MOTS-c regulation in senescence, actinonin (50 μM, 24 h) was used to specifically deplete mtDNA in pancreatic islet cells isolated from 12-week-old C57BL/6 mice. c, Min6 cells were transfected with pGenLenti-empty or pGenLenti-Cdkn2a vectors. In b and c the senescence markers (Igf1r, P16INK4a and γ-H2AX) and mTORC1 pathway-related (p-mTOR-2448, p-p70S6K and p-4EBP-1) proteins were analyzed. The pancreatic islet cells from 12- and 90-week-old mice were treated with either hydrogen peroxide (200 μM, 24 h) and doxorubicin (200 nM, 24 h). d The β-gal+p21+ population in pancreatic islets were analyzed. Two-way ANOVA; the error bars are the s.e.m. *P < 0.05, ****P < 0.0001 for comparison. e Hydrogen peroxide and doxorubicin were treated in pancreatic islet cells isolated from 12- or 90-week-old mice to analyze MOTS-c levels. All western blot data are representative of at least three independent experiments. f Treatment with MOTS-c (10 μM, 24 h), with or without H2O2 (200 μM, 24 h), in pancreatic islet cells isolated from 12-week-old C57BL/6 mice prevented senescence markers, including Cdkn1a, Cdkn2a, Cxcl10 and Il-1b mRNA levels. Two-way ANOVA; the error bars are the s.e.m. *P < 0.05, **P < 0.01, ****P < 0.0001 for comparison. g Pancreatic islet cells isolated from 12-week-old C57BL/6 mice were treated with H2O2 to analyze protein expression levels of γ-H2AX and P16INK4A. Housekeeping mitochondrial and cytoplasmic proteins (MTCOII and β-actin) were confirmed by western blot. h Treatment with MOTS-c (10 μM, 24 h) in the presence or absence of H2O2 (200 μM, 24 h) in pancreatic islet cells isolated from 12-week-old C57BL/6 mice (n = 5 per group) was followed by staining and analysis for β-gal, IL-1β, Cxcl10, IL-6 and Igf1r using flow cytometry. Two-way ANOVA; the error bars are the s.e.m. ****P < 0.0001 for comparison.

References

    1. Aguayo-Mazzucato, C. et al. Acceleration of beta cell aging determines diabetes and senolysis improves disease outcomes. Cell Metab.30, 129–e124.124, 10.1016/j.cmet.2019.05.006 (2019). - PMC - PubMed
    1. Thompson, P. J. et al. Targeted elimination of senescent beta cells prevents type 1 diabetes. Cell Metab.29, 1045–e1010.1060 (2019). - PubMed
    1. Helman, A. et al. p16(Ink4a)-induced senescence of pancreatic beta cells enhances insulin secretion. Nat. Med22, 412–420 (2016). - PMC - PubMed
    1. Varghese, S. S. & Dhawan, S. Senescence: a double-edged sword in beta-cell health and failure? Front Endocrinol.14, 1196460 (2023). - PMC - PubMed
    1. Wiley, C. D. & Campisi, J. The metabolic roots of senescence: mechanisms and opportunities for intervention. Nat. Metab.3, 1290–1301 (2021). - PMC - PubMed

MeSH terms

Substances

LinkOut - more resources