

Identification and validation of oxidative stress signature genes in the trabecular meshwork of glaucoma
- PMID: 40855175
- PMCID: PMC12378223
- DOI: 10.1038/s41598-025-16534-z
Identification and validation of oxidative stress signature genes in the trabecular meshwork of glaucoma
Abstract
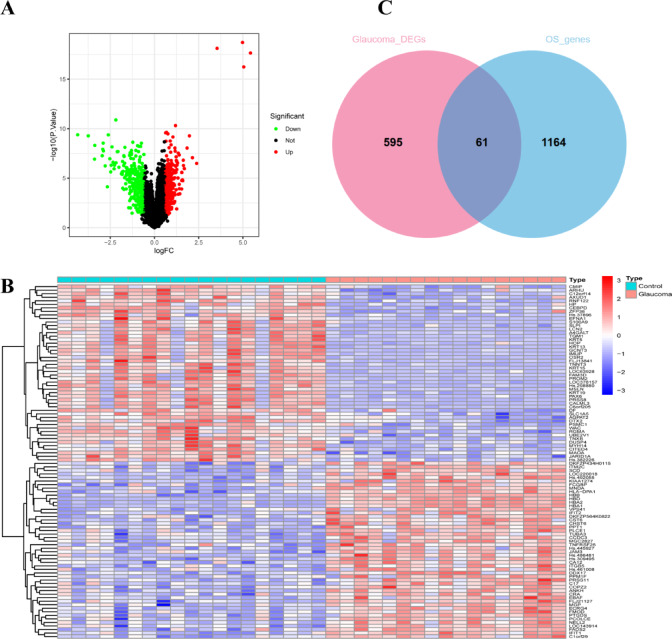
Oxidative stress (OS) plays an important role in trabecular meshwork (TM) dysfunction in glaucoma, but its molecular mechanism remains unclear. We integrated the GSE27276 dataset and OS-related gene sets from GeneCards to screen 61 differentially expressed OS-related genes (DEOSGs). Functional enrichment analysis revealed that these genes are primarily involved in inflammatory and OS-related signaling pathways, including IL-17, TNF, and NF-κB. A protein-protein interaction (PPI) network constructed via the STRING database identified seven hub genes (CCL3, CXCL1, NFKBIA, VCAM1, LCN2, TNFRSF1A, and HP). Validation using the GSE124114, GSE37474, and GSE65240 datasets showed that the expression of CXCL1 and VCAM1 was downregulated, while NFKBIA was upregulated. Additionally, all three genes exhibited an area under the curve (AUC) greater than 0.7. Immune infiltration analysis demonstrated significant associations between these genes and immune cells, particularly regulatory T cells and neutrophils. Regulatory network analysis suggested that transcription factors (RELA, NFKB1) and microRNAs (hsa-miR-34a-5p) may modulate these core genes. Drug-gene interaction studies identified 35 potential therapeutic agents, including Infliximab and Vitamin B6. This study systematically elucidates the molecular mechanisms of OS in glaucoma, proposing that the identified core genes and their regulatory networks not only serve as novel biomarkers for diagnosis but also provide a theoretical foundation for developing targeted therapeutic strategies.
Keywords: Bioinformatics analysis; GEO database; Glaucoma; Hub genes; Oxidative stress; Trabecular meshwork.
© 2025. The Author(s).
Conflict of interest statement
Declarations. Competing interests: The authors declare no competing interests.
Figures


References
-
- Jayaram, H., Kolko, M., Friedman, D. S. & Gazzard, G. Glaucoma: Now and beyond. Lancet402, 1788–1801 (2023). - PubMed
-
- Baudouin, C., Kolko, M., Melik-Parsadaniantz, S. & Messmer, E. M. Inflammation in glaucoma: From the back to the front of the eye, and beyond. Prog. Retin Eye Res.83, 100916 (2021). - PubMed
-
- Almasieh, M., Wilson, A. M., Morquette, B., Cueva, V. J. & Di Polo, A. The molecular basis of retinal ganglion cell death in glaucoma. Prog. Retin. Eye Res.31, 152–181 (2012). - PubMed
-
- Izzotti, A., Bagnis, A. & Saccà, S. C. the role of oxidative stress in glaucoma. Mutat. Res.-Fund Mol. M.612, 105–114 (2006). - PubMed
-
- Saccà, S. C., Izzotti, A., Rossi, P. & Traverso, C. Glaucomatous outflow pathway and oxidative stress. Exp. Eye Res.84, 389–399 (2007). - PubMed
MeSH terms
Substances
Grants and funding
LinkOut - more resources
Full Text Sources
Medical
Research Materials
Miscellaneous
