. 2025 Aug 25;23(1):959.
doi: 10.1186/s12967-025-06788-6.

Sodium-glucose cotransporter 2 inhibitors alleviate renal fibrosis in diabetic kidney disease by inhibiting Hmgcs2 and Btg2 in proximal tubular cells

Affiliations

Sodium-glucose cotransporter 2 inhibitors alleviate renal fibrosis in diabetic kidney disease by inhibiting Hmgcs2 and Btg2 in proximal tubular cells

Shengzhe Yan et al. J Transl Med. .

Abstract

Context: Sodium-glucose cotransporter 2 inhibitors (SGLT2i) have been shown to ameliorate renal fibrosis in diabetic kidney disease (DKD), but the mechanism has not been fully explored.

Methods: The single-cell sequencing (scRNA-seq) data were downloaded from the Gene Expression Omnibus (GEO) database, and we selected the tissue data from db/m mice, db/db mice and db/db mice with SGLT2i treatment. The results were also validated by immunofluorescent staining and western blot in vivo and in vitro, respectively.

Results: Our study demonstrates that SGLT2i directly ameliorated fibrosis of proximal tubular cells by downregulating 3-hydroxy-3-methylglutaryl-CoA synthase 2 (Hmgcs2) expression in S1 proximal tubular segment cells (PT_S1) and decreasing the number of proximal tubular cell cluster with B-cell translocation gene 2 (Btg2) highly expressed (Btg2_PT). In addition, SGLT2i could indirectly influence macrophages through cell-cell communication between epithelial cells and macrophages, specifically via the App-CD74 ligand-receptor pair, thus suppressing the inflammatory response in macrophages, ultimately contributing to the delay in DKD progression.

Conclusion: Our study found that Hmgcs2 and Btg2 are therapeutic targets for Sodium-glucose cotransporter 2 inhibitors to ameliorate kidney fibrosis in diabetic kidney disease. Single-cell sequencing technology provided a high resolution of this study at the cellular level.

Supplementary Information: The online version contains supplementary material available at 10.1186/s12967-025-06788-6.

Keywords: Btg2; Diabetic kidney disease; Hmgcs2; Renal fibrosis; SGLT2i; Single-cell sequencing.


Conflict of interest statement

Declarations. Ethics approval and consent to participate: The animal study and human renal samples were reviewed and approved by ZhuJiang Hospital of Southern Medical University Laboratory Ethics Committee. Competing interests: The authors declare no competing interests.

Figures

Fig. 1
Fig. 1
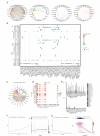
Single-cell map of kidney tissue in mice (A) 43 cell clusters obtained after clustering using UMAP, with each color representing a cell cluster. (B) A total of 3 supcelltypes were defined using markers for cell definition of 43 cell clusters. EP, epithelial cell; IMMUNE CELL, immune cell; STROMAL, stromal cell. (C) A total of 9 cell types were defined using markers for cell definition of 43 cell clusters. Colors and labels indicate different cell types based on marker gene expression. PT, proximal tubule cells; PT-S1, S1 proximal tubular segment; mt-PT, proximal renal tubular epithelial cell with mitochondrial gene highly expressed; DT, distal renal tubule epithelial cell; EC, endothelial cell; LOH, loop of henle; MC, medullary cell; T, T lymphocyte; MAC, macrophage. (D) Bubble plot shows the expression of marker genes for each cell type. The color of the dots represents the average log2 fold change (LogFC) value. (E) Bar plot shows the number of each cell type in different groups. (F) Plotline plot shows the change of the proportion of PT, PT-S1, mt-PT, T and MAC in different groups
Fig. 2
Fig. 2
SGLT2i downregulate the expression of Hmgcs2 in PT_S1 cells to prevent the fibrosis (A) PT_S1 cells were integrated into a single dataset and clustered using UMAP. Labels indicate different cell types. (B) Bar plot shows the Number of identified cell types in each sample. (C) Plotline plot shows the change of the proportion of Hmgcs2_PT_S1, Napsa PT_S1, Cela1 PT_S1and S100a8_PT_S1 in different groups. (D) Expression of selected marker genes for each cell type projected on UMAP. (E-F) The gene set variation analysis (GSVA) shows the EMT score and EMT expression on PT_S1 subclusters. (G) Bar plot shows the EMT expression in different groups. (H) Assessment of stemness in PT_S1. (I) Pseudo-Temporal analysis in PT_S1. (J) The Gene Regulatory Network (GRN) analysis showed that the Hmgcs2_PT_S1 was uniquely regulated by Egr1 in the M5 module. (K) scCor correlation analysis showed that Slc5a2 had a direct positive correlation with the expression of Hmgcs2.( p < 0.001) (L) KEGG enrichment analysis showed that the effect of SGLT2 on Hmgcs2_PT_S1 may be mediated through MAPK signaling pathways
Fig. 3
Fig. 3
SGLT2i decrease the number of Btg2_PT to suppress fibrotic changes in proximal tubular cells. (A) PT cells were integrated into a single dataset and clustered by UMAP. Labels indicate different cell types. (B) Bar plot shows the Number of identified cell types in each sample. (C) Plotline plot shows the change of the proportion of Btg2_PT, Gatm_PT, Col27a1_PT, Slco1a1_PT and Apoe_PT in different groups. (D) Expression of selected marker genes for each cell type projected on UMAP. (E-F) The gene set variation analysis (GSVA) shows the EMT score on PT subclusters. (CI95% [-1.3%, -1.2%], p < 0.001). (G) Violin plot shows the EMT expression in different groups. (H) Assessment of stemness in PT. (I) Pseudo-Temporal analysis in PT. (J) Expression of top genes at different stages of differentiation (K) The Gene Regulatory Network (GRN) analysis showed that the Hmgcs2_PT_S1 was uniquely regulated by Egr1 in the M5 module. (L) KEGG enrichment analysis showed that the effect of SGLT2 on Btg2_PT may be mediated through MAPK signaling pathways *p < 0.05, **p < 0.01, and ***p < 0.001
Fig. 4
Fig. 4
SGLT2i has anti-inflammatory effects on tissue by suppressing the immune response of macrophages and T lymphocytes. (A) T cells were integrated into a single dataset and clustered using UMAP. Labels indicate different cell types. (B) Expression of selected marker genes for each cell type projected on UMAP. (C) Bar plot shows the Number of identified cell types in each sample. (D) Plotline plot shows the change of the proportion of identified cell types in different groups. (E) Macrophages were integrated into a single dataset and clustered using UMAP. Labels indicate different cell types. (F) Expression of selected marker genes for each cell type projected on UMAP. (G) Bar plot shows the Number of identified cell types in each sample. (H) Plotline plot shows the change of the proportion of identified cell types in different groups
Fig. 5
Fig. 5
SGLT2i indirectly influences macrophages through cell-cell communication between proximal tubular cells and macrophages via the App-CD74 ligand-receptor pair (A) Cell communication analysis showed that interactions existed between epithelial cells and immune cells (B-D) the App-CD74 ligand-receptor pair exhibit higher activity and potential between Hmgcs2_PT_S1, Btg2_PT and Ctss_MAC. (E) The expression of App and CD74 in PT, PT_S1, macrophages and T lymphocytes clusters. (F) scCor correlation analysis showed that App had a direct positive correlation with fibrosis (CI95% [2.33e-03, -0.02], p < 0.01)and the expression of Slc5a2 (p < 0.001) in PT and PT_S1. (G) scCor correlation analysis showed that Cd74 had a direct negative correlation with inflammation (CI95% [-0.41, -0.35], p < 0.001) and the expression of Slc5a2 (p < 0.05)in Ctss_MAC
Fig. 6
Fig. 6
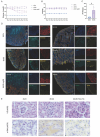
Validation of Hmgcs2 and Btg2 on mice (A) Glucose of mice from different groups. (B) Weight of mice from different groups. (C) UPCR of mice from different groups. (CI95% [14.29, 74.07], p < 0.05) (D) Representative immunofluorescence images from each group for LRP2(PT marker, red) and SGLT2 (PT-S1 marker, green), and BTG2/HMGCS2 (yellow) (E) Representative HE and immunohistochemistry of α-SMA images from each group. *p < 0.05, **p < 0.01, and ***p < 0.001
Fig. 7
Fig. 7
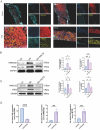
Validation of HMGCS2 and BTG2 on human (A) Representative immunofluorescence images from human renal slices for LRP2(PT marker, red) and SGLT2 (PT-S1 marker, green), and BTG2/HMGCS2 (yellow) (B) Representative western blot images from each group for Hmgcs2, Btg2 and Gapdh in hRPTC. (C) Representative western blot images from each group for Hmgcs2, Btg2 and Gapdh in HK-2 cells. (D) The RT-qPCR results showed that down-regulation of SLC5A2(CI95% [-1.03, -0.87]) in HK-2 cells could directly up-regulate the RNA expression levels of HMGCS2 (CI95% [2.75, 7.55]) and BTG2(CI95% [1.06, 3.19]). n = 3/group. Means (± S.E.) of n = 3 independent experiments. *p < 0.05, **p < 0.01, and ***p < 0.001

Similar articles

References

    1. Yamazaki T, Mimura I, Tanaka T, Nangaku M. Treatment of diabetic kidney disease: current and future. Diabetes Metab J. 2021;45:11–26. - PMC - PubMed
    1. Tuttle KR, et al. Molecular mechanisms and therapeutic targets for diabetic kidney disease. Kidney Int. 2022;102:248–60. - PubMed
    1. Loeffler I, Wolf G. Epithelial-to-Mesenchymal transition in diabetic nephropathy: fact or fiction?? Cells. 2015;4:631–52. - PMC - PubMed
    1. Perkovic V, et al. Canagliflozin and renal outcomes in type 2 diabetes and nephropathy. N Engl J Med. 2019;380:2295–306. - PubMed
    1. Alicic RZ, Johnson EJ, Tuttle KR. SGLT2 Inhibition for the prevention and treatment of diabetic kidney disease: A review. Am J Kidney Dis. 2018;72:267–77. - PubMed

LinkOut - more resources