

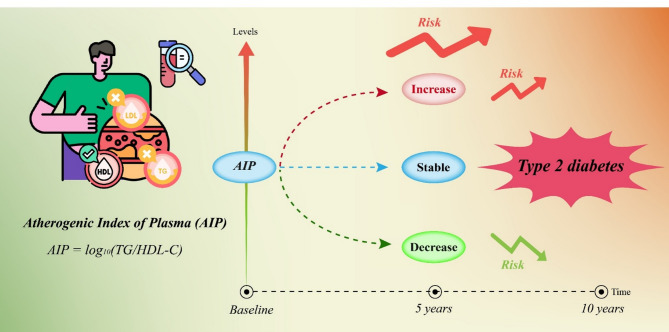
Atherogenic index of plasma and its 5-year changes associated with type 2 diabetes risk: a 10-Year cohort study
- PMID: 40855436
- PMCID: PMC12376724
- DOI: 10.1186/s12933-025-02903-5
Atherogenic index of plasma and its 5-year changes associated with type 2 diabetes risk: a 10-Year cohort study
Abstract
Background: The global burden of type 2 diabetes mellitus (T2DM) is increasing, particularly in resource-limited settings like rural China. Although traditional blood glucose remains an essential measurement for diabetes screening, Atherogenic Index of Plasma (AIP) is emerging as a complementary predictor of T2DM risk. Over time, however, the association between AIP and T2DM risk remains insufficiently understood.
Objective: To investigate the association between baseline AIP levels and its 5-year changes with the risk of T2DM in a rural Chinese cohort.
Methods: This prospective cohort study enrolled 14,968 participants without baseline diabetes from a rural Chinese population. AIP was calculated (log(TG/HDL-C)) and used to classify participant results into quartiles. We conducted multivariate Cox proportional hazards regression analysis, restricted cubic spline analyses, subgroup analyses, and sensitivity analyses to determine the association between baseline AIP and 5-year changes in AIP with the 10-year risk of T2DM.
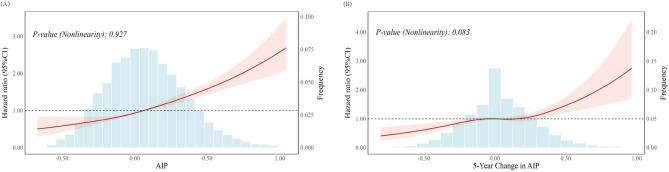
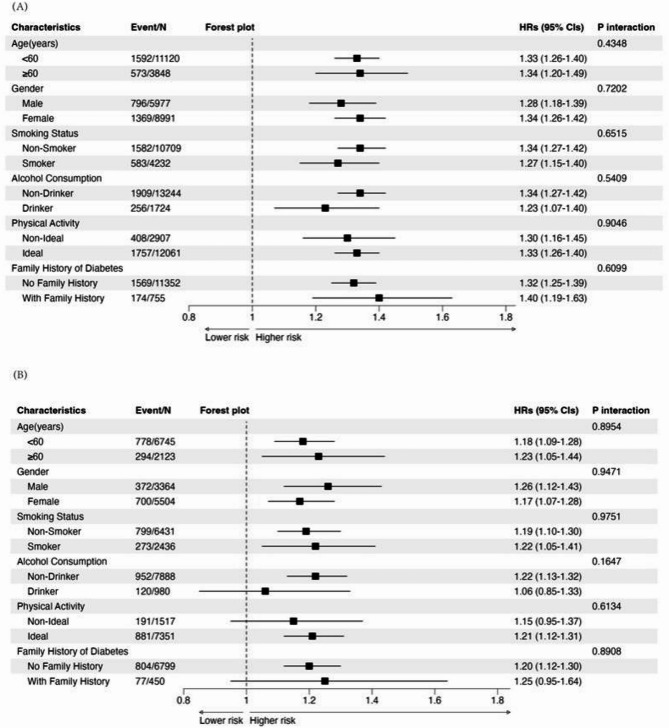
Results: Over a median follow-up of 10.4 years, 2,165(N = 14,968) participants developed T2DM. The hazard ratios [aHRs; 95% confidence interval (CI)] for T2DM increased with quartiles 2, 3, and 4 (versus quartile 1) of AIP: 1.17 (1.00-1.38), 1.38 (1.18-1.62), and 1.96 (1.68-2.29), respectively (p for trend < 0.0001) after multivariable adjustment. Regarding 5-year changes in AIP, participants with increased AIP levels had a 18% higher risk of developing T2DM (aHRs 1.18, 95% CIs: 1.00-1.40) compared to those maintaining stable levels, while those with decreased AIP showed a 20% reduction in risk (aHRs 0.80, 95% CIs: 0.67-0.95). RCS analyses showed linear relationships for both baseline AIP (p for nonlinearity = 0.927) and 5-year changes in AIP (p for nonlinearity = 0.083) with T2DM risk.
Conclusions: Our findings indicate that both baseline AIP levels and the 5-year changes in those levels are significantly associated with the risk of T2DM. Individuals with higher baseline AIP or 5-year increases in AIP were more likely to develop T2DM.
Keywords: Atherogenic index of plasma; Change in AIP; Cohort study; Hazard ratio; Type 2 diabetes mellitus.
© 2025. The Author(s).
Conflict of interest statement
Declarations. Competing interests: The authors declare no competing interests.
Figures
Similar articles
-
Association between atherogenic index of plasma and type 2 diabetes in women with a history of gestational diabetes mellitus: a cross-sectional study.Diabetol Metab Syndr. 2025 Aug 20;17(1):344. doi: 10.1186/s13098-025-01914-2. Diabetol Metab Syndr. 2025. PMID: 40830800 Free PMC article.
-
[Association between obesity and the risk of microvascular complications in Yinzhou District, Ningbo adults with type 2 diabetes mellitus].Wei Sheng Yan Jiu. 2025 Jul;54(4):608-620. doi: 10.19813/j.cnki.weishengyanjiu.2025.04.012. Wei Sheng Yan Jiu. 2025. PMID: 40695761 Chinese.
-
Association of the atherogenic index of plasma and high-sensitivity C-reactive protein with incident cardiovascular disease: evidence from a national cohort of middle-aged and older Chinese adults.Front Endocrinol (Lausanne). 2025 Aug 6;16:1618157. doi: 10.3389/fendo.2025.1618157. eCollection 2025. Front Endocrinol (Lausanne). 2025. PMID: 40842496 Free PMC article.
-
Diet, physical activity or both for prevention or delay of type 2 diabetes mellitus and its associated complications in people at increased risk of developing type 2 diabetes mellitus.Cochrane Database Syst Rev. 2017 Dec 4;12(12):CD003054. doi: 10.1002/14651858.CD003054.pub4. Cochrane Database Syst Rev. 2017. PMID: 29205264 Free PMC article.
-
Insulin secretagogues for prevention or delay of type 2 diabetes mellitus and its associated complications in persons at increased risk for the development of type 2 diabetes mellitus.Cochrane Database Syst Rev. 2016 Oct 17;10(10):CD012151. doi: 10.1002/14651858.CD012151.pub2. Cochrane Database Syst Rev. 2016. PMID: 27749986 Free PMC article.
References
-
- Saeedi P, Petersohn I, Salpea P, Malanda B, Karuranga S, Unwin N, et al. Global and regional diabetes prevalence estimates for 2019 and projections for 2030 and 2045: results from the international diabetes federation diabetes atlas, 9th edition. Diabetes Res Clin Pract. 2019;157: 107843. - PubMed
-
- Dobiasova M, Frohlich J. The new atherogenic plasma index (AIP) reflects the ratio of triglycerides and HDL-cholesterol, size of lipoprotein particles and esterification rate of cholesterol: changes after lipanor treatment. Vnitr Lek. 2000;46:152–6. - PubMed
-
- Zhou K, Qin Z, Tian J, Cui K, Yan Y, Lyu S. The atherogenic index of plasma: a powerful and reliable predictor for coronary artery disease in patients with type 2 diabetes. Angiology. 2021;72:934–41. - PubMed
MeSH terms
Substances
Grants and funding
LinkOut - more resources
Full Text Sources
Medical
Miscellaneous
