. 2025 Aug 25;23(1):379.
doi: 10.1186/s12964-025-02369-8.

Senescent fibroblasts secrete CTHRC1 to promote cancer stemness in hepatocellular carcinoma

Affiliations

Senescent fibroblasts secrete CTHRC1 to promote cancer stemness in hepatocellular carcinoma

Hai Huang et al. Cell Commun Signal. .

Abstract

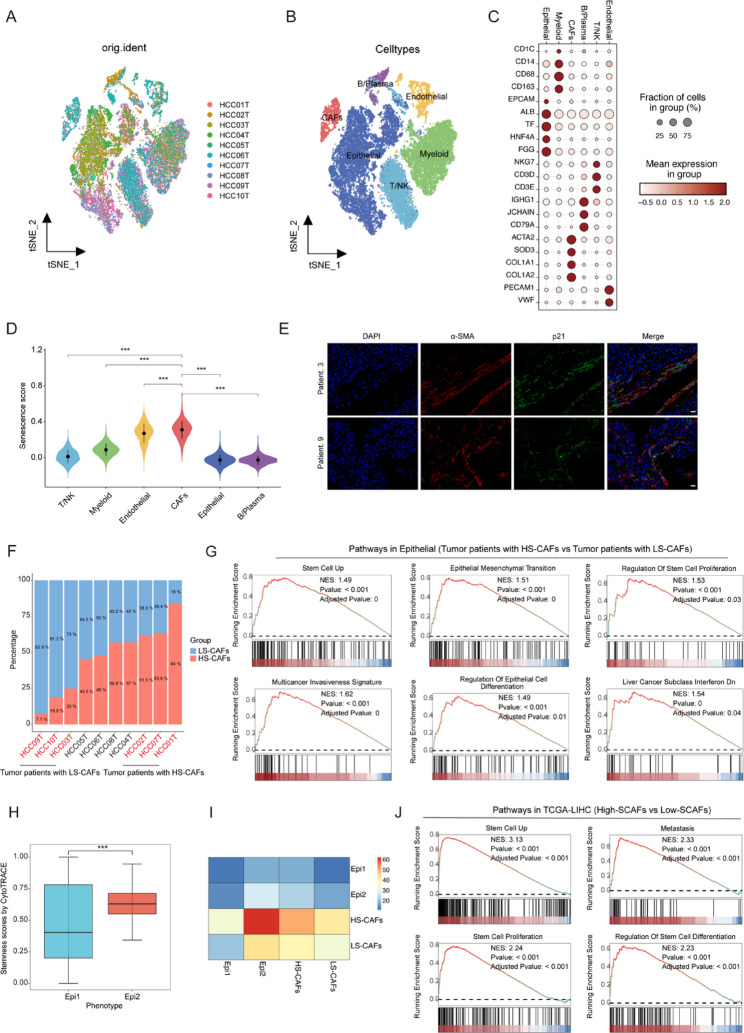
Background: Cellular senescence plays a significant role in tumorigenesis and tumor progression. Substantial evidence indicates that senescence occurs in cancer-associated fibroblasts (CAFs), the predominant stromal component within the tumor microenvironment (TME), which profoundly impacts tumor biology. However, despite growing evidence of stromal cell involvement in cancer progression, the specific mechanisms and clinical implications of senescent CAFs (SCAFs) in hepatocellular carcinoma (HCC) have not been fully elucidated.

Methods: The senescence signature was utilized to evaluate the senescence status of cell types within the TME of HCC using the GSE149614 dataset. The CytoTRACE and cell-cell communication analysis were used to find the correlation between cancer stemness and SCAFs. A risk prediction model associated with SCAFs was constructed to investigate potential mechanisms by which SCAFs promote tumor progression. Single-cell RNA sequencing data was used to identify senescent CAF-related genes. Gene expression and clinical data for HCC were obtained from the Cancer Genome Atlas (TCGA), International Cancer Genome Consortium (ICGC), and National Omics Data Encyclopedia (NODE) databases. Using four machine-learning algorithms, crucial genes were identified to develop a CAF-senescence-related risk model, predicting prognosis, cancer stemness, immune infiltration, tumor mutation burden, and therapeutic responses in HCC patients. Next, we explored the role of Collagen Triple Helix Repeat Containing-1 (CTHRC1) in cancer stemness using both in vitro and in vivo experiments. Through various functional experiments, we elucidated the downstream signaling pathways of CTHRC1. Additionally, chromatin immunoprecipitation experiments were used to verify that key transcription factors bind to the CTHRC1 promoter region.

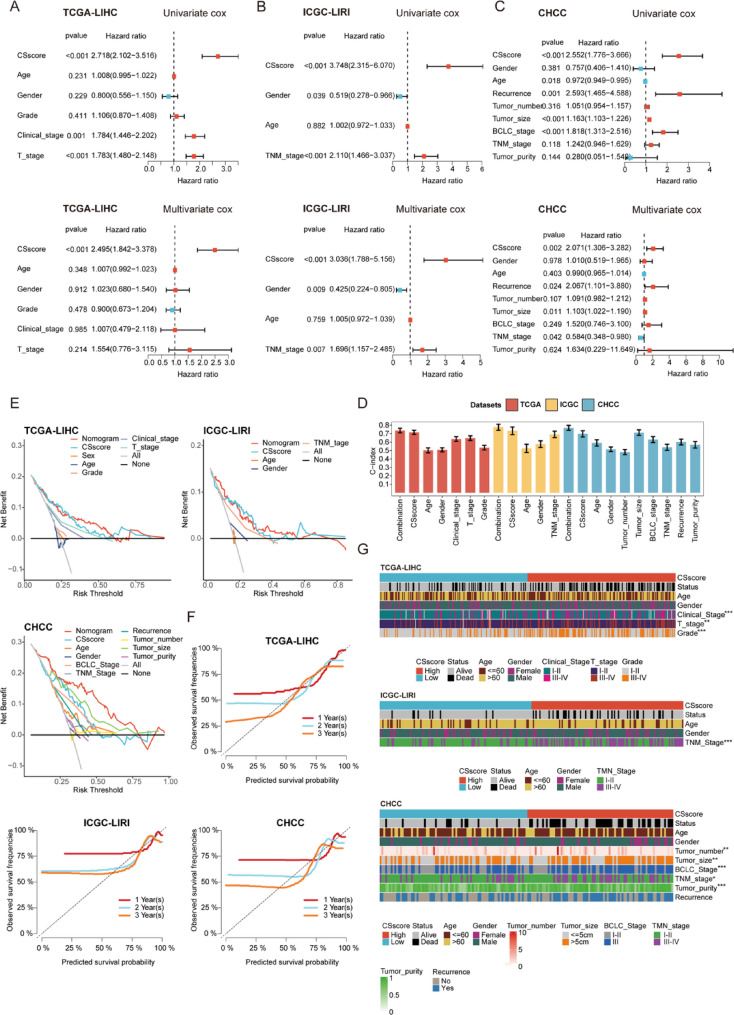
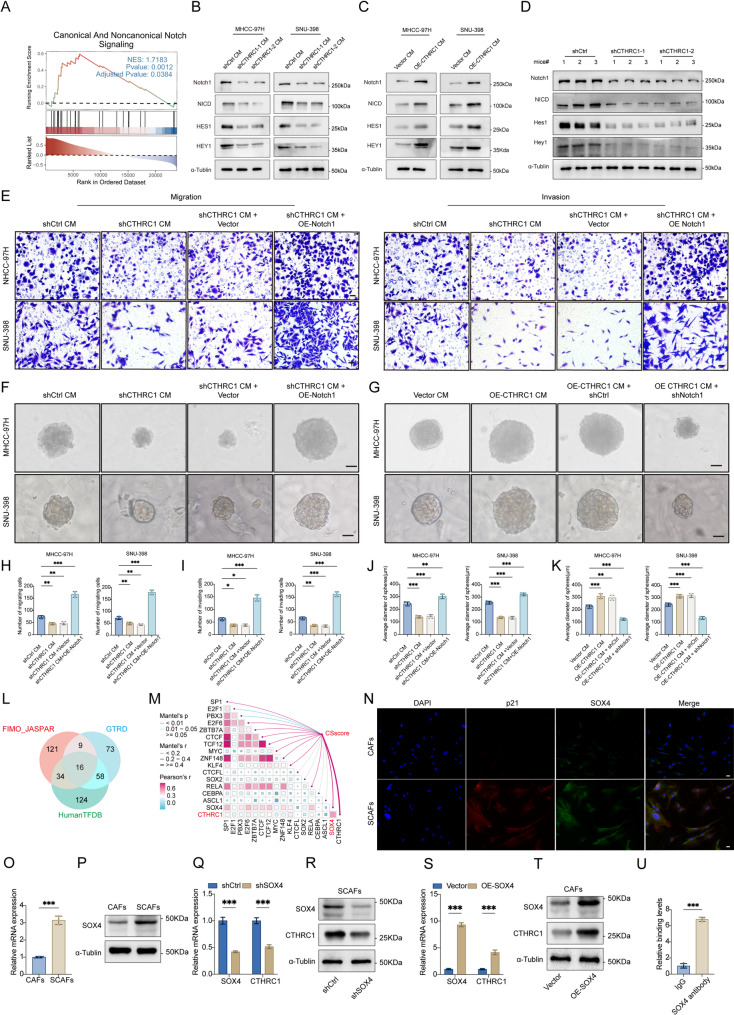
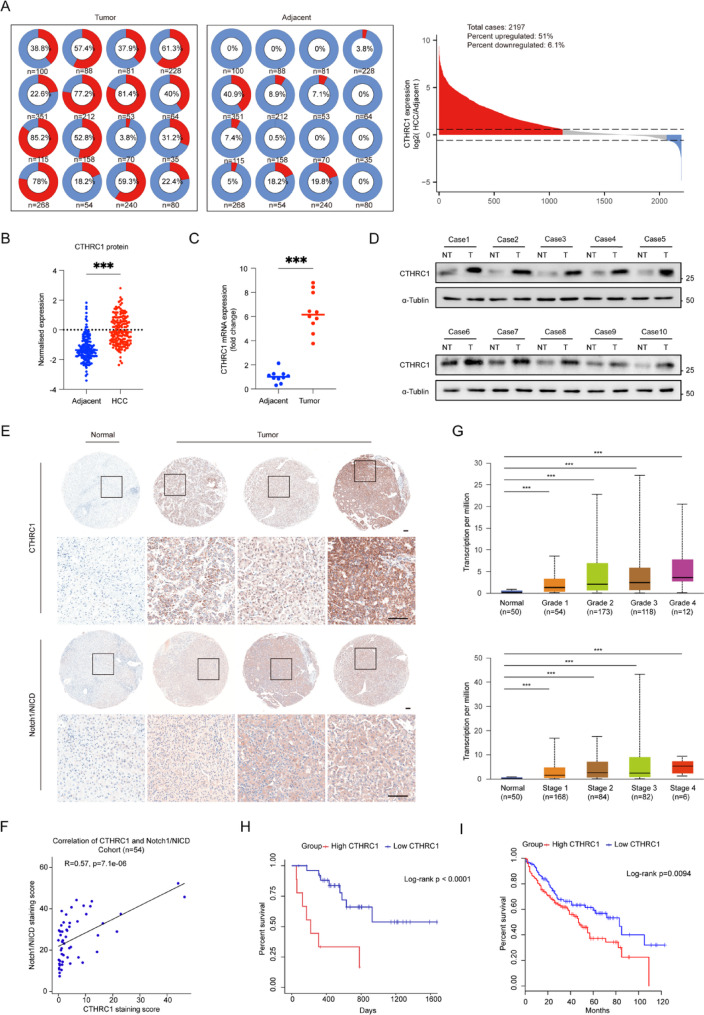
Results: CAFs exhibited high senescence status and a strong correlation with cancer stemness in HCC. A novel CAF-senescence-score (CSscore) prognostic model was established for HCC based on 10 genes: CTHRC1, SERPINE1, RNF11, ENG, MARCKSL1, ASAP1, FHL3, LAMB1, CD151, and OLFML2B. The survival prediction performance was validated on TCGA, ICGC, and NODE cohorts. Immune analysis revealed that the CSscore was positively correlated with immunosuppressive immune cell populations, including M2 macrophages and regulatory T cells. Conversely, a negative correlation was observed between the CSscore and anti-tumor immune cells such as CD8 + T cells, dendritic cells, and B cells HCC patients with a low CSscore had a lower tumor mutation burden and showed improved responsiveness to immunotherapy and transarterial chemoembolization. In vitro experiments and bioinformatics analysis further revealed that CTHRC1 was significantly elevated in SCAFs promoted cancer stemness and metastasis via the SRY-box transcription factor 4 (SOX4)-CTHRC1-Notch1 axis in HCC.

Conclusion: Our study revealed that SCAFs were strongly correlated with cancer stemness in HCC. A novel machine learning model based on senescent CAF-related genes was constructed to accurately predict prognosis in HCC patients. Furthermore, CTHRC1 was identified as a novel prognostic and therapeutic biomarker to predict poor prognosis in HCC and promote cancer stemness and metastasis through the Notch signaling pathway, with its expression being transcriptionally regulated by SOX4.

Keywords: Cancer stemness; Cancer-associated fibroblasts; Cellular senescence; Hepatocellular carcinoma; Notch signaling pathway.


Conflict of interest statement

Declarations. Ethics approval and consent to participate: The TCGA and GEO databases are publicly available. Users can download the data for free for research purposes and publish related articles. The present study for animal experiments was approved by the Institutional Animal Care and Use Committee, Huazhong University of Science and Technology (HUST), Wuhan, China. The present study for collecting clinical samples was approved by the Ethics Committee of Tongji Hospital, Huazhong University of Science and Technology (HUST), Wuhan, China. Consent for publication: Not applicable. Competing interests: The authors declare no competing interests.

Figures

Fig. 1
Fig. 1
Cellular senescence landscape in the HCC microenvironment. A t-SNE plot showing the distribution profile of HCC samples. B Visualization of the six major cell types identified in the HCC microenvironment. C Dot plot depicting expression of specific cell markers used for cluster annotation and cell type identification. D Violin plot illustrating cellular senescence score across different cell clusters. E Representative immunofluorescence images showing presence of SCAFs(α-SMA+p21+cells) in HCC. Scale bar, 20 μm. F The proportions of HS-CAFs and LS-CAFs in scRNA-seq. G GSEA revealed significant pathway enrichment in epithelial cells in the HS-CAFs group. H Boxplot showing the stemness scores of each subcluster from CytoTRACE in epithelial cells. I Heatmap showing intercellular communication intensity between CAF subclusters and epithelial cell subclusters. J GSEA revealed significant pathway enrichment in the H-SCAFs group. Data presented as mean ± SD. *p < 0.05, **p < 0.01, ***p < 0.001 indicate statistical significance
Fig. 2
Fig. 2
Senescent cancer-associated fibroblasts promote HCC stemness. A Representative immunofluorescence images showing proportion of SCAFs in HCC. Scale bar, 20 μm. B SA-β-Gal staining of CAFs treated with 400 µM H2O2. Scale bar, 20 μm. C qRT-PCR analysis of expression of p16, p21, and p53 genes in senescent and non-senescent CAFs. D Western blot analysis of the p16, p21, and p53 expression in senescent and non-senescent CAFs. E qRT-PCR analysis of the expression levels of cytokines, chemokines, and MMPs family members. F Proliferation ability of the indicated cells measured by EdU assay. Scale bar, 20 μm. G Migration and invasion abilities of the indicated cells measured by Transwell assay. Scale bar, 20 μm. H Self-renewal ability of the indicated cells measured by sphere formation assay. Scale bar, 100 μm. I Sorafenib resistance of the indicated cells was measured by CCK-8 cytotoxicity assays. J Western blot analysis of stemness and EMT-related genes expression. K Photographs and weights of livers from mice. L Representative images of H&E staining of mice lungs. Scale bar, 500 μm. Data presented as mean ± SD. *p < 0.05, **p < 0.01, ***p < 0.001 indicate statistical significance
Fig. 3
Fig. 3
Construction of the prognostic CSscore model based on machine learning. A Top 10 genes selected by LASSO, XGBoost, RF, and GBM algorithms, respectively. B Venn diagram showing the intersection of prognostic genes selected by the four machine learning approaches. C Distribution of the CSscore according to the survival status and time in TCGA-LIHC, ICGC-LIRI, and CHCC cohorts. D, E Kaplan-Meier survival curves (D) and AUC values (E) for the three cohorts. F Restricted mean survival time between H- and L-CSscore groups stratified by the median value in the three cohorts
Fig. 4
Fig. 4
Independent prognostic analysis of the CSscore prognostic model. AC Univariate and multivariate analyses of the CSscore for the OS across three cohorts. D Comparison of C-index values for the CSscore model across all three cohorts. E Decision curve analyses demonstrating the clinical utility of the CSscore across the three cohorts. F Calibration curves for 1-year, 2-year, and 3-year survival predictions using the CSscore model in all three cohorts. G Distribution of clinical features presented as histograms across the three cohorts. Data presented as mean ± SD. *p < 0.05, **p < 0.01, ***p < 0.001 indicate statistical significance
Fig. 5
Fig. 5
Functional annotation of the CSscore in the TCGA-LIHC cohort. A Functional enrichment analysis of GO and KEGG pathways associated with the CSscore. B Differential hallmark pathway activities between the L- and H-CSscore groups scored by GSVA. C GSEA revealed significant pathway enrichment associated with the CSscore. D Correlation analysis between the CSscore and mRNAsi, and an ssGSEA-based stemness index. E Association between the CSscore and immune cell abundance profiles. F Comparative ssGSEA analysis between L- and H-CSscore groups. Data presented as mean ± SD. *p < 0.05, **p < 0.01, ***p < 0.001 indicate statistical significance
Fig. 6
Fig. 6
TMB and therapy response in the TCGA-LIHC cohort. A Comparative analysis of the MATH score between the H- and L-CSscore groups. B, C Kaplan-Meier survival analyses of the CSscore, and the combination of the MATH score/CSscore, respectively. D TMB comparison between the H- and L-CSscore groups. E Association between the CSscore and anti-cancer immune activities evaluated using the TIP algorithm. F TIDE score comparison between L- and H-CSscore groups. G Kaplan-Meier analysis of OS stratified by the CSscore in the IMvigor210 cohort. H, I Differential analysis of the CSscore across immunotherapy response categories in the IMvigor210 cohort. J Kaplan-Meier analysis of OS stratified by the CSscore in the GSE91061 cohort. K, L Differential analysis of the CSscore across immunotherapy response categories in the GSE91061 cohort. M, N NTP analysis of the CSscore in relation to TACE therapy response in the GSE104580 cohort
Fig. 7
Fig. 7
CTHRC1 is overexpressed in SCAFs. A qRT-PCR analysis of the expression of 10 crucial genes. B Comparative mRNA expression of SERPINE1, CTHRC1, and MARCKSL1 across diverse cell types in the GSE149614 dataset. C Correlation between SERPINE1, CTHRC1, and MARCKSL1 expression and senescence score determined by ssGSEA in the TCGA-LIHC dataset. D The association between SERPINE1, CTHRC1, and MARCKSL1 expression and senescence score calculated via AddModuleScore in the GSE149614 dataset. E The secreted concentrations and intracellular expression levels of CTHRC1 in CAFs and SCAFs were measured by ELISA. F Representative immunofluorescence images for p21 and CTHRC1 in CAFs and SCAFs. Scale bar, 20 μm. G Western blot analysis of CTHRC1 expression in CAFs, SCAFs, and tumor tissue. H Representative mIHC images showed expression of α-SMA, p21, and CTHRC1 in HCC. Scale bar, 20 μm. Data presented as mean ± SD. *p < 0.05, **p < 0.01, ***p < 0.001 indicate statistical significance
Fig. 8
Fig. 8
CTHRC1 derived from SCAFs promotes HCC stemness. A Migration and invasion capabilities assessed by transwell assay in indicated cells. Scale bar, 20 μm. B Self-renewal capacity evaluated through sphere formation assay in indicated cells. Scale bar, 100 μm. C Sorafenib resistance determined by CCK-8 cytotoxicity assays in indicated cells. D Migration and invasion capabilities assessed by Transwell assay in indicated cells. Scale bar, 20 μm. E Self-renewal capacity evaluated through sphere formation assay in indicated cells. Scale bar, 100 μm. F Sorafenib resistance determined by CCK-8 cytotoxicity assays in indicated cells. G, H Western blot analysis of stemness and EMT-related genes expression. I Photographs and weight of the liver in mice. J Representative images of H&E staining of mice lungs. Scale bar, 500 μm. Data presented as mean ± SD. *p < 0.05, **p < 0.01, ***p < 0.001 indicate statistical significance
Fig. 9
Fig. 9
SCAFs promote cancer stemness via the SOX4-CTHRC1-Notch1 axis. A GSEA revealed enrichment of the Notch pathway from the Enricher database in the group with high-CTHRC1 expression in the TCGA-LIHC cohort. B, C Western blot analysis of Notch1, NICD, Hes1, and Hey1 expression in HCC cells, respectively. D Western blot analysis of Notch1, NICD, Hes1, and Hey1 expression in mice tumor tissues, respectively. E Migration and invasion capabilities assessed by Transwell assay in indicated cells. Scale bar, 20 μm. F, G Self-renewal capacity evaluated through sphere formation assay in indicated cells. Scale bar, 100 μm. H, I Statistical analysis of Transwell migration and invasion assays. J, K Statistical analysis of sphere formation assays. L Venn diagram of predicted transcription factors. M Correlation analysis between selected transcription factors, CTHRC1 expression, and the CSscore. N Representative immunofluorescence images showing p21 and SOX4 expression. Scale bar, 20 μm. O, P qRT-PCR (O) and western blot analysis (P) of SOX4 expression in indicated cells, respectively. QT qRT-PCR (Q, S) and western blot analysis (R, T) of SOX4 and CTHRC1 in indicated cells, respectively. U qRT-PCR was used to detect the SOX4 in the ChIP assay. Data presented as mean ± SD. *p < 0.05, **p < 0.01, ***p < 0.001 indicate statistical significance
Fig. 10
Fig. 10
High expression of CTHRC1 is associated with HCC malignancy and clinical prognosis. A Comparative mRNA expression analysis of CTHRC1 across 16 cohorts from the HCCDB database. B CTHRC1 protein expression levels quantified from the CPTAC database. C CTHRC1 mRNA expression in HCC patient samples (n = 10). D Western blot analysis of CTHRC1 protein expression in HCC patient samples. E Representative IHC images of HCC and adjacent normal tissues. Scale bar, 100 μm. F Correlation analysis between CTHRC1 and Notch1/NICD protein expression levels. G CTHRC1 expression data from the UALCAN TCGA database demonstrating association with advanced tumor grade and clinical stage. H, I Kaplan-Meier survival analyses showing correlation between elevated CTHRC1 expression in HCC tissues and reduced overall survival from our cohort (H) and GEPIA database (I), respectively. Data presented as mean ± SD. *p < 0.05, **p < 0.01, ***p < 0.001 indicate statistical significance

Similar articles

References

    1. Bray F, Laversanne M, Sung H, Ferlay J, Siegel RL, Soerjomataram I, Jemal A. Global cancer statistics 2022: GLOBOCAN estimates of incidence and mortality worldwide for 36 cancers in 185 countries. CA Cancer J Clin. 2024;74:229–63. - PubMed
    1. Forner A, Reig M, Bruix J. Hepatocellular carcinoma. Lancet. 2018;391:1301–14. - PubMed
    1. Yang C, Zhang H, Zhang L, Zhu AX, Bernards R, Qin W, Wang C. Evolving therapeutic landscape of advanced hepatocellular carcinoma. Nat Rev Gastroenterol Hepatol. 2023;20:203–22. - PubMed
    1. Lee TK, Guan XY, Ma S. Cancer stem cells in hepatocellular carcinoma - from origin to clinical implications. Nat Rev Gastroenterol Hepatol. 2022;19:26–44. - PubMed
    1. Hanahan D. Hallmarks of cancer: new dimensions. Cancer Discov. 2022;12:31–46. - PubMed

MeSH terms

Substances