. 2025 Aug 25;25(1):547.
doi: 10.1186/s12866-025-04287-8.

Uropathogenic Escherichia coli (UPEC) that hides its identity: features of LC2 and EC73 strains from recurrent urinary tract infections

Affiliations

Uropathogenic Escherichia coli (UPEC) that hides its identity: features of LC2 and EC73 strains from recurrent urinary tract infections

Linda Maurizi et al. BMC Microbiol. .

Abstract

Background: Uropathogenic Escherichia coli (UPEC) strains are the major causative agents of human urinary tract infections (UTIs). Many patients who develop UTIs will experience a recurrent UTI (RUTI) within 6 months despite antibiotic-mediated clearance of the initial infection. A significant proportion of RUTIs are caused by E. coli identical to the original strain. UPEC employs several strategies to adhere, colonize, and persist within the bladder niche. Knowledge about the mechanisms regulating specific host-pathogen interactions that promote bacterial persistence is necessary to develop new approaches to RUTI diagnosis and treatment.

Results: LC2 and EC73 UPEC strains were collected from patients with RUTIs. E. coli CFT073 and K-12 MG1655 were used as reference strains. UPEC displayed phenotypic profiles like those of the general E. coli population. The pan-genome analysis revealed that LC2 harbored many unique genes encoding several different functions such as intracellular trafficking and secretion, and vesicular transport. Contrarily, EC73 was the strain with the lowest number of unique genes involved in replication, recombination, repair and cell wall/membrane/envelope biogenesis. LC2 and EC73 exhibited the capacity to invade bladder monolayers efficiently and to colonize the gut of Caenorhabditis elegans, with LC2 being significantly more virulent than EC73. T24 cells infected with EC73 and LC2 strains exhibited significantly increased mRNA levels of IL-6, IL-8, IL-1β and TNF-α. EC73 elicited the strongest cytokine response. Differently, no significant cytokine mRNA induction was detected in T24 cells infected with E. coli CFT073. LC2 and EC73 modulated the expression of proteins involved in reactive oxygen species (ROS) balance in infected cells, but to different extents.

Conclusion: The acquisition of virulence factors by horizontal transfer of accessory DNA, other than being the cause of transformation to pathogenic strains, is responsible for the genomic plasticity. Our findings suggest that a key role in RUTIs could be played by certain bacterial strains that may benefit from peculiar abilities to adapt and potentially develop reservoirs of persistence across different host environments.

Keywords: Bladder; Recurrence; Urinary tract infections; Uropathogenic Escherichia coli.


Conflict of interest statement

Declarations. Ethics approval and consent to participate: The bacterial strains were collected precisely in 2006 and were present in our Laboratory as collection isolates. At “Sapienza” University of Rome the Ethics Committee for Transdisciplinary Research (CERT in Italian), that ensures that Sapienza University research follows ethical principles defined by international and national regulations and the Sapienza Statute and Code of Ethics, it has been established in 2021 (RD no. 59099/2021) (se https://www.uniroma1.it/en/pagina/ethics-committee-transdisciplinary-research ). Consent for publication: Not applicable. Competing interests: The authors declare no competing interests.

Figures

Fig. 1
Fig. 1
Pan-genome analysis of E. coli strains LC2, EC73, UTI89, CFT073 and MG1655. A Each circle in the Venn diagram represents a single strain (indicated in bold), while the numbers correspond to core, accessory, and unique genes detected in the pan-genome. Overlapping regions reflect the number of genes shared between the corresponding circles (hence, strains). B, C COG functional analysis of LC2 (B) and EC73 (C). For each COG functional category, the different bar color indicates the number of associated core-, accessory- and unique-genes detected in the individual strains. COG categories: A = RNA processing and modification; C = Energy production & conversion; D = Cell cycle control, cell division, chromosome partitioning; E = Amino acid transport & metabolism; F = Nucleotide transport & metabolism; G = Carbohydrate transport & metabolism; H = Coenzyme transport & metabolism; I = Lipid transport & metabolism; J = Translation, ribosomal structure & biogenesis; K = Transcription; L = Replication, recombination & repair; M = Cell wall/membrane/envelope biogenesis; N = Cell motility; O = Post-translational modification, protein turnover & chaperones; P = Inorganic ion transport & metabolism; Q = Secondary metabolites biosynthesis, transport & catabolism; R = General function prediction only; S = Function unknown; T = Signal transduction mechanisms; U = Intracellular trafficking, secretion & vesicular transport; V = Defense mechanisms; W = Extracellular structures.
Fig. 2
Fig. 2
In silico analysis of VFs typical of UPEC strains. The presence or absence of 30 selected VFs assessed by in silico analysis across E. coli strains LC2, EC73, CFT073, MG1655, UTI89, and 83,972. The heatmap displays the distribution of genes according to functional VF categories, each represented by a distinct color
Fig. 3
Fig. 3
RT-qPCR analysis of different cytokine mRNA levels in bladder epithelial cells T24 infected with E. coli strains. Values were reported as mean ± SD of triplicate samples from three independent experiments. Statistical significance was determined by one-way ANOVA followed by post hoc analysis; asterisks indicate significant differences (** p < 0.01; * p < 0.05)
Fig. 4
Fig. 4
Quantification of IL-6 protein levels by ELISA assay in bladder epithelial cells T24 infected with E. coli strains. Values are expressed as mean ± SD of duplicate samples from two independent experiments. Statistical significance was determined by one-way ANOVA followed by post hoc analysis; asterisks indicate significant differences (***p < 0.001).
Fig. 5
Fig. 5
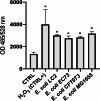
Evaluation of oxidative stress of T24 cells after 24 h of bacterial infection. Values were reported as mean ± SD. All considered conditions were compared to untreated control. Asterisks indicate significant differences (* p ≤ 0.05).
Fig. 6
Fig. 6
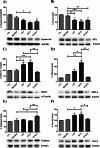
Western blot and densitometry analysis of System Xc⁻ (A), Glutamine Cysteine Ligase (GCL) (B), Superoxide Dismutase-1 (SOD-1) (C), Superoxide Dismutase-2 (SOD-2) (D), Catalase (E) and NADPH oxidase (Nox2) (F) in T24 cells infected with E. coli strains MG1655, LC2, EC73 and CFT073. Statistical analysis was evaluated by one-way ANOVA with the Tukey post-hoc test; asterisks indicate significant differences (*p ≤ 0.05; **p ≤ 0.01; ***p ≤ 0.001).
Fig. 7
Fig. 7
A Kaplan–Meier survival curves of C. elegans infected with various E. coli strains. B Colonization of UPEC strains in the intestinal tract of C. elegans. A Infections were conducted at 25 °C, and nematode survival was monitored daily. Worms fed with E. coli CFT073 or OP50 served as the control groups (n = 80). Statistical significance was assessed using the Log-rank (Mantel-Cox) test; asterisks denote significant differences (***p < 0.001; ns: not significant). B Differences in colonization levels were evaluated, with asterisks indicating statistically significant differences (*p < 0.05; ***p < 0.001; ns: not significant). The red asterisks refer to OP50, while the blue ones to CFT073.
Fig. 8
Fig. 8
Persistence of uropathogenic E. coli LC2 and EC73. A Fluorescence microscopy of wild type N2 worms fed with E. coli OP50-GFP and LC2 or EC73 pathogens in a 1:1 ratio and (B) related MFI. Scale bar = 100 μm control: worms fed OP50-GFP alone. Statistical analysis was evaluated by one-way ANOVA with the Bonferroni post-test; asterisks indicate significant differences (***p < 0.001; ns: not significant). Bars represent the mean of three independent experiments

Similar articles

References

    1. Hannan TJ, Totsika M, Mansfield KJ, Moore KH, Schembri MA, Hultgren SJ. Host-pathogen checkpoints and population bottlenecks in persistent and intracellular uropathogenic Escherichia coli bladder infection. FEMS Microbiol Rev. 2012;36(3):616–48. - PMC - PubMed
    1. McLellan LK, Hunstad DA. Urinary tract infection: pathogenesis and outlook. Trends Mol Med. 2016;22:946–57. - PMC - PubMed
    1. Terlizzi ME, Gribaudo G, Maffei ME. Uropathogenic Escherichia coli (UPEC) infections: virulence factors, bladder responses, antibiotic, and non-antibiotic antimicrobial strategies. Front Microbiol. 2017;8:1566. - PMC - PubMed
    1. Martinez JJ, Mulvey MA, Schilling JD, Pinkner JS, Hultgren SJ. Type 1 pilus-mediated bacterial invasion of bladder epithelial cells. EMBO J. 2000;19:2803–12. - PMC - PubMed
    1. Klein RD, Hultgren SJ. Urinary tract infections: microbial pathogenesis, host-pathogen interactions and new treatment strategies. Nat Rev Microbiol. 2020;18:211–26. - PMC - PubMed

MeSH terms

Substances

LinkOut - more resources