Comparative Study
. 2025 Aug 1;18(8):dmm052324.
doi: 10.1242/dmm.052324. Epub 2025 Aug 26.

Multi-modal comparative phenotyping of knock-in mouse models of frontotemporal dementia/amyotrophic lateral sclerosis

Affiliations
Comparative Study

Multi-modal comparative phenotyping of knock-in mouse models of frontotemporal dementia/amyotrophic lateral sclerosis

Sevda Boyanova et al. Dis Model Mech. .

Abstract

Amyotrophic lateral sclerosis (ALS) and frontotemporal dementia (FTD) are progressive adult-onset neurodegenerative diseases with overlapping pathological and genetic origins. They are caused by multiple underlying mechanisms leading to a common collection of clinical features that occur in a spectrum. Here, we report side-by-side longitudinal behavioural, cognitive and sensory phenotyping of two mouse models of ALS/FTD, to determine which aspects of the disease they recapitulate. We used knock-in models, in which the endogenous mouse orthologues of the C9orf72 and TARDBP (encoding TDP-43) genes have been altered to model specific molecular aspects of ALS/FTD. We found that the C9orf72GR400/+ model exhibits age-related deficit in short-term memory and that parental genotype affects exploration activity in offspring. In the TardbpQ331K/Q331K model, we found age-related changes in weight, fat mass, locomotion and marble burying. In both models, we found no evidence of deficits in vision or olfactory habituation-dishabituation. These data provide new insight into genotype-phenotype relationships in these ALS/FTD mice, which can be used to inform model choice and experimental design in future research studies.

Keywords: Amyotrophic lateral sclerosis; Frontotemporal dementia; Mouse phenotyping.


Conflict of interest statement

Competing interests F.K.W. has undertaken fee consultancy for Alnylam Pharmaceuticals for work unconnected to this study. The other authors declare no competing or financial interests.

Figures

Fig. 1.
Fig. 1.
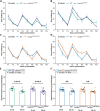
Weight and body composition in the C9orf72GR400/+ and TardbpQ331K/Q331K mouse models. (A-D) Weight of mice (A,B), fat mass (C) and lean mass (D) measured by echo-MRI was determined in WT female (green solid line), WT male (green dashed line), C9orf72GR400/+ female (purple solid line), C9orf72GR400/+ male (purple dashed line) (A), and WT female (blue solid line), WT male (blue dashed line), TardbpQ331K/Q331K female (orange solid line) and TardbpQ331K/Q331K male (orange dashed line) (B-D) mice between 4 and 72 weeks of age. (B) Female TardbpQ331K/Q331K mice were heavier than female WT mice from 48 weeks of age (P=0.0141), and male TardbpQ331K/Q331K mice were heavier than male WT mice from 54 weeks (P=0.0199). (C) Fat mass was higher in female TadbpQ331K/Q331K mice from 48 weeks of age (P=0.000212), and higher in male TadbpQ331K/Q331K mice from 64 weeks of age (P=0.018), compared to that in WT mice of the respective sex. (D) Lean mass was higher in male TardbpQ331K/Q331K mice from 64 weeks of age (P=0.0046) compared to that in male WT controls. *P<0.05, **P<0.01, ***P<0.001, ****P<0.0001 (linear mixed-effects model and post-hoc analysis with Bonferroni correction). Error bars represent mean±s.e.m. Each point shows an average value±s.e.m for each genotype and sex group; in the weight data, the value for each mouse at each age is an average of one to ten measurements; for echo-MRI, the value for each mouse is from a single measurement. For detailed animal numbers, see Tables S1 and S2. For complete statistical output, see Table S4.
Fig. 2.
Fig. 2.
Assessment of sensory function in the C9orf72GR400/+ and TardbpQ331K/Q331K mouse models. (A-D) Sniffing time, for the first, second and third presentations of familiar social odour (F1, F2, F3), novel social odour (N1, N2, N3) and water odour (W1, W2, W3), to WT (green) and C9orf72GR400/+ (purple) (A,B), and WT (blue) and TardbpQ331K/Q331K (orange) (C,D), mice at 15 (A,C) and 67 (B,D) weeks of age. Both models showed normal olfactory habituation and dishabituation. (E,F) Threshold of visual acuity as measured by spatial frequency (cycles/degree) in the optokinetic drum assay at 15-16 and 68 weeks of age in WT (green) and C9orf72GR400/+ (purple) (E), and WT (blue) and TardbpQ331K/Q331K (orange) (F), mice. Black circles, males; white circles, females. (E) An age-related decrease in visual acuity in WT (P<0.0001) and C9orf72GR400/+ (P<0.0001) mice was observed between 15 and 68 weeks of age. (F) An age-related decrease in visual acuity was observed in WT (P=0.0012) and TardbpQ331K/Q331K (P=0.0014) mice between 16 and 68 weeks of age. **P<0.01, ****P<0.0001 (linear mixed-effects model and post-hoc analysis with Bonferroni correction). Error bars represent mean±s.e.m. For olfaction, each point shows average time sniffing±s.e.m.; for each genotype group, each mouse was tested once at every odour presentation. For visual acuity, each circle shows data from a single mouse in one repeat of the test at each age. In the C9orf72 study, for the olfaction videos, at 15 weeks, WT n=24, C9orf72GR400/+ n=24; at 67 weeks, WT n=20, C9orf72GR400/+ n=18; for visual acuity, at 15 weeks, WT n=23, C9orf72GR400/+ n=23; at 68 weeks, WT n=20, C9orf72GR400/+ n=20. In the Tardbp study, for the olfaction videos, at 15 weeks, WT n=27, TardbpQ331K/Q331K n=24; at 67 weeks, WT n=21, TardbpQ331K/Q331K n=20; for visual acuity, at 16 weeks, WT n=27, TardbpQ331K/Q331K n=26; at 68 weeks, WT n=21, TardbpQ331K/Q331K n=20. Mice that did not engage with the first presentation of each type of odour were excluded from the olfaction analysis. For complete statistical output, see Table S4.
Fig. 3.
Fig. 3.
Assessment of anxiety-like behaviour and general executive functions in the C9orf72GR400/+ and TardbpQ331K/Q331K mouse models. (A-D) Duration and frequency of entry into each section of the elevated plus maze by WT (green) and C9orf72GR400/+ (purple) (A,B), and WT (blue) and TardbpQ331K/Q331K (orange) (C,D), mice at 11-12 weeks of age. (E-H) Number of marbles buried in the marble-burying test by WT (green) and C9orf72GR400/+ (purple) mice at 14 and 66.5 weeks (E,F), and WT (blue) and TardbpQ331K/Q331K (orange) mice at 14 and 67 weeks (G,H). Black circles, males; white circles, females. The TardbpQ331K/Q331K mice buried fewer marbles at 67 weeks of age compared to WT mice (P=0.03914). *P<0.05 (Kruskal–Wallis test). Error bars represent mean±s.e.m. Each circle shows data from a single mouse in one repeat of the test at each age, and at each section for the elevated plus maze. In the C9orf72 study, for elevated plus maze and marble burying at 14 weeks, WT n=24, C9orf72GR400/+ n=24; for marble burying at 66.5 weeks, WT n=20, C9orf72GR400/+ n=20. In the Tardbp study, for elevated plus maze, WT n=27, TardbpQ331K/Q331K n=26; for marble burying at 14 weeks, WT n=27, TardbpQ331K/Q331K n=27; at 67 weeks, WT n=21, TardbpQ331K/Q331K n=20. For complete statistical output, see Table S4.
Fig. 4.
Fig. 4.
Locomotor activity during social preference test in the C9orf72GR400/+ and TardbpQ331K/Q331K mouse models. (A-D) Total distance travelled during the habituation and test phases of the social preference test by WT (green) and C9orf72GR400/+ (purple) mice at 18.5 and 70 weeks of age (A,B), and WT (blue) and TardbpQ331K/Q331K (orange) mice at 18 and 71 weeks of age (C,D). Black circles, males; white circles, females. (A,B) The 70-week-old C9orf72GR400/+ mice moved less than the 18.5-week-old ones during habituation (P=0.0302) (A) and test (P=0.0110) (B) phases. (C,D) The TardbpQ331K/Q331K mice moved less than WT mice during habituation (P=0.0162) (C) and test (P<0.0001) (D) phases at 71 weeks of age. *P<0.05, ****P<0.0001 (linear mixed-effects model and post-hoc analysis with Bonferroni correction). Error bars represent mean±s.e.m. Each circle shows data from a single mouse in one repeat of the test at each age. In the C9orf72 study, at 18.5 weeks, WT n=22, C9orf72GR400/+ n=24; at 70 weeks, WT n=20, C9orf72GR400/+ n=19. In the Tardbp study, at 18 weeks, WT n=27, TardbpQ331K/Q331K n=27; at 71 weeks, WT n=20, TardbpQ331K/Q331K n=20. For complete statistical output, see Table S4.
Fig. 5.
Fig. 5.
Social preference ratio (SPR) in the social preference test in the C9orf72GR400/+ and TardbpQ331K/Q331K mouse models. (A-D) SPR based on time (A,C) and frequency (B,D) in WT (green) and C9orf72GR400/+ (purple) mice at 18.5 and 70 weeks (A,B), and WT (blue) and TardbpQ331K/Q331K (orange) mice at 18 and 71 weeks (C,D). Black circles, males; white circles, females. *P<0.05, **P<0.01 (linear mixed-effects model and post-hoc analysis with Bonferroni correction). Error bars represent mean±s.e.m. Each circle shows data from a single mouse in one repeat of the test at each age. In the C9orf72 study, at 18.5 weeks, WT n=22, C9orf72GR400/+ n=24; at 70 weeks, WT n=20, C9orf72GR400/+ n=19. In the Tardbp study, at 18 weeks, WT n=27, TardbpQ331K/Q331K n=27; at 71 weeks, WT n=20, TardbpQ331K/Q331K n=20. For complete statistical output, see Table S4.
Fig. 6.
Fig. 6.
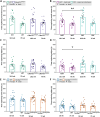
Time spent with a novel mouse or an object in the social preference test in the C9orf72GR400/+ and TardbpQ331K/Q331K mouse models, and the effect of parental mutation inheritance in the C9orf72GR400/+ model. MAT, maternal; PAT, paternal. Black circles, males; white circles, females. (A-F) Duration spent with a novel mouse (A,B,E) or an object (C,D,F) in the social preference test by WT (green) and C9orf72GR400/+ (purple) mice at 18.5 and 70 weeks (A,C), plotted by genotype irrespective of origin of mutation inheritance. (B,D) Maternal inheritance of the C9orf72GR400/+ mutation (magenta), or paternal inheritance of the C9orf72GR400/+ mutation (turquoise), at 18.5 and 70 weeks, plotted by origin of mutation inheritance, irrespective of genotype. (E,F) Duration spent with a novel mouse (E) or an object (F) in WT (blue) and TardbpQ331K/Q331K (orange) mice at 18 and 71 weeks of age. (B,D) In the C9orf72GR400 study, the mice with paternal mutation carrier explored the novel mouse (P=0.0093) (B) and the object (P=0.0373) (D) longer than the mice with maternal mutation carrier, irrespective of offspring genotype. *P<0.05 (linear mixed-effects model and post-hoc analysis with Bonferroni correction). Error bars represent mean±s.e.m. Each circle shows data from a single mouse in one repeat of the test at each age. In the C9orf72 study, at 18.5 weeks, WT n=22, C9orf72GR400/+ n=24, MAT n=23, PAT n=23; at 70 weeks, WT n=20, C9orf72GR400/+ n=19, MAT n=22, PAT n=17. In the Tardbp study, at 18 weeks, WT n=27, TardbpQ331K/Q331K n=27; at 71 weeks, WT n=20, TardbpQ331K/Q331K n=20. For complete statistical output, see Table S4.
Fig. 7.
Fig. 7.
Locomotor activity during the Y-maze test for short-term spatial memory in the C9orf72GR400/+ and TardbpQ331K/Q331K mouse models. (A-D) Total distance travelled during the habituation (A,C) and test (B,D) phases of the Y-maze test by WT (green) and C9orf72GR400/+ (purple) mice at 12.5 and 64.5 weeks (A,B), and WT (blue), TardbpQ331K/Q331K (orange) mice at 12.5 and 65.5 weeks (C,D). Black circles, males; white circles, females. (A) In the C9orf72GR400 study, no significant post-hoc effects were observed for total distance travelled during habituation. (B) The C9orf72GR400/+ mice moved less at the 64.5-week time point than at the 12.5-week time point (P=0.0159) during the test phase. (C,D) The TradbpQ331K/Q331K mice moved less than WT mice at 65.5 weeks of age, during both habituation (P=0.0041) (C) and test (P=0.0356) (D) phases. *P<0.05, **P<0.01 (linear mixed-effects model and post-hoc analysis with Bonferroni correction). Error bars represent mean±s.e.m. Each circle shows data from a single mouse in one repeat of the test at each age. In the C9orf72 study, at 12.5 weeks, WT n=21, C9orf72GR400/+ n=20; at 64.5 weeks, WT n=21, C9orf72GR400/+  n=20. In the Tardbp study, at 12.5 weeks, WT n=27, TardbpQ331K/Q331K n=27; at 65.5 weeks, WT n=20, TardbpQ331K/Q331K n=21. For complete statistical output, see Table S4.
Fig. 8.
Fig. 8.
Novel preference ratio (NPR) in the Y-maze test for short-term spatial memory in the C9orf72GR400/+ and TardbpQ331K/Q331K mouse models. (A-D) NPR based on time (A,C) and frequency (B,D) in WT (green) and C9orf72GR400/+ (purple) mice at 12.5 and 64.5 weeks of age (A,B), and WT (blue) and TardbpQ331K/Q331K (orange) mice at 12.5 and 65.5 weeks of age (C,D). Black circles, males; white circles, females. (A) In the C9orf72GR400 study, no significant post-hoc effects were observed when comparing genotypes at each age for NPR based on time (s). (B) The C9orf72GR400/+ model showed genotype-age-related decrease in the NPR based on frequency compared to that in WT mice (P=0.0308) at 64.5 weeks of age. (C,D) Age-related decrease in the NPR in the WT (P=0.0005) and TardbpQ331K/Q331K (P=0.0315) mice when calculated based on frequency (D), and only in the WT mice, when calculated based on time (P=0.0174) (C). *P<0.05, ***P<0.001 (linear mixed-effects model and post-hoc analysis with Bonferroni correction). Error bars represent mean±s.e.m. Each circle shows data from a single mouse in one repeat of the test at each age. In the C9orf72 study, at 12.5 weeks, WT n=21, C9orf72GR400/+ n=20; at 64.5 weeks, WT n=21, C9orf72GR400/+ n=20. In the Tardbp study, at 12.5 weeks, WT n=27, TardbpQ331K/Q331K n=26; at 65.5 weeks, WT n=19, TardbpQ331K/Q331K n=21. For complete statistical output, see Table S4.

References

    1. Abramzon, Y. A., Fratta, P., Traynor, B. J. and Chia, R. (2020). The overlapping genetics of amyotrophic lateral sclerosis and frontotemporal dementia. Front. Neurosci. 14, 42. 10.3389/fnins.2020.00042 - DOI - PMC - PubMed
    1. Ahmed, R. M., Irish, M., Piguet, O., Halliday, G. M., Ittner, L. M., Farooqi, S., Hodges, J. R. and Kiernan, M. C. (2016a). Amyotrophic lateral sclerosis and frontotemporal dementia: distinct and overlapping changes in eating behaviour and metabolism. Lancet Neurol. 15, 332-342. 10.1016/S1474-4422(15)00380-4 - DOI - PubMed
    1. Ahmed, R. M., Irish, M., Henning, E., Dermody, N., Bartley, L., Kiernan, M. C., Piguet, O., Farooqi, S. and Hodges, J. R. (2016b). Assessment of eating behavior disturbance and associated neural networks in frontotemporal dementia. JAMA Neurol. 73, 282. 10.1001/jamaneurol.2015.4478 - DOI - PubMed
    1. Ahmed, R. M., Caga, J., Devenney, E., Hsieh, S., Bartley, L., Highton-Williamson, E., Ramsey, E., Zoing, M., Halliday, G. M., Piguet, O.et al. (2016c). Cognition and eating behavior in amyotrophic lateral sclerosis: effect on survival. J. Neurol. 263, 1593-1603. 10.1007/s00415-016-8168-2 - DOI - PubMed
    1. Ahmed, R. M., Irish, M., Van Eersel, J., Ittner, A., Ke, Y. D., Volkerling, A., Van Der Hoven, J., Tanaka, K., Karl, T., Kassiou, M.et al. (2017). Mouse models of frontotemporal dementia: a comparison of phenotypes with clinical symptomatology. Neurosci. Biobehav. Rev. 74, 126-138. 10.1016/j.neubiorev.2017.01.004 - DOI - PubMed

Publication types

MeSH terms