. 2025 Aug 26;82(1):320.
doi: 10.1007/s00018-025-05862-y.

Immunoregulatory properties of cell free DNA

Affiliations

Immunoregulatory properties of cell free DNA

Francesca Ferrera et al. Cell Mol Life Sci. .

Abstract

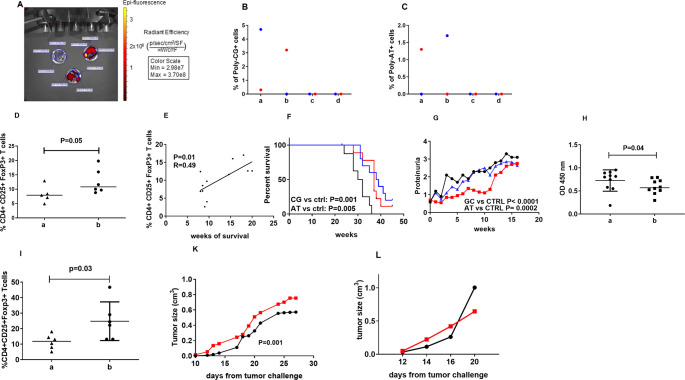
Cell free DNA (cfDNA) is detectable at low concentrations in the plasma of healthy subjects and at high concentrations in disorders characterized by a high rate of necrotic events, such as tumors and vasculitis, leading to the release of necrotic DNA into the surrounding tissue and the bloodstream. Although cfDNA may act as a danger signal by binding to DNA sensors, triggering inflammation and immune responses, elevated cfDNA concentrations instead may exert immunoregulatory activities. Here, we show that exogenously administered cfDNA mediates immunoregulatory functions in vivo, in particular, it protects lupus-prone mice from disease progression and favors tumor growth in tumor-challenged mice. Our data suggest that cfDNA mediates immune regulatory activities by directly interacting with MHC class II molecules on antigen-presenting cells and through recruitment of regulatory T cells. This study unveils unprecedented biologic functions of cfDNA with significant pathogenic relevance and remarkable implications for the treatment of cancer patients.

Keywords: Autoimmune diseases; Cell free DNAs; Immune-modulations; Tumors.


Conflict of interest statement

Declarations. Ethics approval: This study was performed in line with the principles of the Declaration of Helsinki. Approval was granted by the local ethics committee (NCT02293707). All the procedures on animals were carried out by animal facilities qualified staff in accordance with the guidelines provided in Ministero della Salute D.lgs 26/2014. (pr. N. 778/2016-PR and 475/2018-PR). Consent to participate: Informed consent was obtained from all individual participants included in the study. Competing interests: The authors have no relevant financial or non-financial interests to disclose.

Figures

Fig. 1
Fig. 1
cfDNA inhibits antigen-specific T cell proliferation. (A) Representative OVA-specific proliferation assay performed with splenic T cells isolated from an OVA-immunized BALB/c mouse stimulated with: (a) irradiated autologous splenocytes; (b) irradiated autologous splenocytes plus OVA; (c) irradiated autologous splenocytes plus OVA and the poly-C/poly-G oligonucleotide (100 ng/ml); (d) irradiated autologous splenocytes plus OVA and cfDNA from cancer patients (2.5 ng/ml). (B) The graph shows the results of OVA-specific proliferation assays performed with splenic T cells from different OVA-immunized BALB/c mice incubated with irradiated autologous splenocytes plus OVA (left value); irradiated autologous splenocytes plus OVA and the poly-C/poly-G oligonucleotide (100 ng/ml) (middle value); irradiated autologous splenocytes plus OVA and cfDNA from cancer patients (2.5 ng/ml) (right value). Background values, corresponding to the percentage of proliferation of non-antigen stimulated splenic T cells from OVA-immunized BALB/c mice grown in the presence of irradiated autologous splenocytes without antigen, have been subtracted. Data are expressed as mean ± standard deviation. All values are expressed as mean ± standard error of the mean (SEM); three experiments, N = 3 mice per group; one-way ANOVA with additional Dunnett post-hoc test correction performed for groups multiple comparison.
Fig. 2
Fig. 2
cfDNA modulates cytokines production in macrophages. Panels A and B: IL-6 (A) and IL-10 (B) cytokine levels in supernatants derived from RAW cells stimulated with LPS alone (a) or LPS and Poly-C/poly-G oligonucleotide (100 ng/ml) (b).Transcriptomic analysis of intracellular concentrations of mRNA coding for either IL6 (C) or IL10 (D) in LPS pre-activated PMJ2-PC macrophages treated (b) or not (a) with the poly-C/poly-G oligonucleotide (100 ng/ml), * p-value < 0.05
Fig. 3
Fig. 3
cfDNA binds to MHC class II molecules. (A) Lysates of splenocytes from a BWF1 mouse at different concentrations (150 ug lane 1 and 75 ug lane 2) were run on SDS-PAGE gel and then blotted. The membranes were incubated with either the poly-C/poly-G oligonucleotide followed by an anti-dsDNA mAb (a) or an anti-I-Ad MHC class II mAb (b). Bands with the identical molecular weight were detected in both conditions. The molecular standards are shown on the right side of each blot (Invitrogen Seeblue LC5925). (B) Binding of Cy5.5-labeled poly-C/poly-G oligonucleotide to MHC class II + B lymphocytes (a, b,c,) and monocytes (d, e,f, g,h) from IL-2 stimulated splenocytes of C57BL mice. (a) The gate showing B cells has been identified by splenocytes incubation with an anti-CD3 and an anti-CD19 mAbs; (b) Expression of MHC class II by B lymphocytes; (c) Staining of B cells incubated (red peak) or not (blue peak) with the Cy5.5-labeled poly-C/poly-G oligonucleotide; (d) The gate showing monocytes has been identified by splenocytes incubation with an anti-CD3 and an anti-CD11b mAbs; (e) Expression of MHC class II by monocytes: the upper, middle and lower squares show cells with high (CD11b + MHC-II bright), intermediate (CD11b + MHC-II dim) and absent (CD11b + MHC-II neg) MHC class II expression, respectively; (f) Staining of MHC Class II high monocytes with the Cy5.5-labeled poly-C/poly-G oligonucleotide; (g) Staining of MHC Class II intermediate monocytes with the Cy5.5-labeled poly-C/poly-G oligonucleotide; (h) Staining of MHC Class II negative monocytes with the Cy5.5-labeled poly-C/poly-G oligonucleotide. (C) BLI at different concentration of (a) I-Ad class II monomer, (b) I-Ab class II monomer and (c) H-2Kb class I monomer. It was possible to generate excellent fitting curves based on MHC monomer concentrations for MHC class II but not for MHC class I monomers
Fig. 4
Fig. 4
Docking analysis on the MHC class II poly-C/poly-G complex. (A) Three-dimensional model of the MHC class II complex herein investigated. Alpha helix and beta sheets are colored in red and yellow, respectively. (B) The best-scored binding site at the MHC class II complex is depicted by red and grey spheres, together with the patch areas calculated by the patch analyzer module implemented in MOE. (C) Docking of poly-C/poly-G at the MHC class II model surface. (D) Most relevant patch areas identified by molecular modeling analyses. (E) Key contacts related to the docking of poly-C/poly-G at the MHC class II model
Fig. 5
Fig. 5
cfDNA-induced variation in gene expression. (A) 40 genes analyzed by Bio-Rad iQ5 analysis in LPS pre-activated PMJ2-PC macrophages treated (blue bar) or not (green bar) with the poly-C/poly-G oligonucleotide (1 µg/ml for 3 h), * p-value < 0.05 and ** p-value < 0.001; (B) Quantitative PCR analysis on mRNAs coding for MAPK-14, EGR-1, and CCL22 in LPS pre-activated PMJ2-PC macrophages treated (black bar) or not (white bar) with the poly-C/poly-G oligonucleotide (1 µg/ml for 3 h). Data are expressed as fold change (2− ΔΔCT) normalized with GAPDH. Data are the mean of 3 concordant experiments; Student paired T test (C) Network analysis using the STRING-DB software of differentially expressed genes (EGR-1 and CCL22) between pre-activated PMJ2-PC macrophages treated or not with the poly-C/poly-G oligonucleotide. EGR-1 and CCL22 genes are showed in red circles
Fig. 6
Fig. 6
cfDNA effects in BWF1 SLE-prone (A-H) and in tumor challenged C57Bl (I-L) mice. (A) In Vivo Imaging System scanning, performed on spleens, kidneys and livers of BWF1 mice organs after 120 min from i.v. administration of the Cy5.5-labeled poly-C/poly-G oligonucleotide. (B) Percentage of Cy5.5-labeled poly-C/poly-G oligonucleotide labeled cells among (a) B lymphocytes, (b) macrophages, (c) T cells and (d) NK cells from splenocytes of Cy5.5-labeled poly-C/poly-G oligonucleotide administered mice (two mice, each color identifies data collected by each single mouse). (C) Percentage of Cy5.5-labeled poly-A/poly-T oligonucleotide labeled cells among (a) B lymphocytes, (b) macrophages, (c) T cells and (d) NK cells from splenocytes of Cy5.5-labeled poly-A/poly-T oligonucleotide administered mice (two mice, each color identifies data collected by each single mouse). (D) Frequency of CD4 + FoxP3 + CD25 + Treg among splenocytes from BWF1 SLE-prone mice untreated (a) or weekly i.v. administered with the poly-C/poly-G oligonucleotide (b). Student T test. (E) Correlation between survival and frequency of CD4 + FoxP3 + CD25 + Treg among splenocytes from BWF1 SLE-prone mice weekly i.v. administered with either the poly-C/poly-G or the poly-A/poly-T oligonucleotide. (F) Survival and (G) proteinuria levels of BWF1 SLE-prone mice untreated (black line) or weekly i.v. administered with either poly-C/poly-G (red line) or poly-A/poly-T (blue line) oligonucleotides (10 mice/group). The figure shows the mean of values achieved in one of two concordant experiments. Long-Rank (Mantel-Cox) Test for survival and 2way Anova Test for proteinuria. (H) Circulating anti-dsDNA antibody concentrations in untreated (a) and DNA administered (b) mice. Student T test. (I) Frequency of intratumoral CD4 + FoxP3 + CD25 + Treg from B16 melanoma induced C57BL mice untreated (a) or weekly i.v. administered with the poly-C/poly-G oligonucleotide (b) 6 mice/group, Student T test. (K) Tumor growth in B16F10 melanoma challenged C57BL mice administered (red line) or not (black line) with the poly-C/poly-G oligonucleotide. The figure shows the mean of values achieved in one of two concordant experiments. 7 mice/group, 2way Anova Test (L) Tumor growth in B16F10 melanoma challenged MHC class II KO C57BL mice administered (red line) or not (black line) with the poly-C/poly-G oligonucleotide. The figure shows the mean of values achieved in one experiment. 5 mice/group

References

    1. Mandel P, Metais P (1948) Nuclear acids in human blood plasma. CR Seances Soc Biol Fil 142:241–243 - PubMed
    1. Van der Vaart M, Pretorius PJ (2008) Circulating DNA. Its origin and fluctuation. Ann N Y Acad Sci 1137:18–26. 10.1196/annals.1448.022 - PubMed
    1. Leon SA, Shapiro B, Sklaroff DM, Yaros MJ (1977) Free DNA in the serum of cancer patients and the effect of therapy. Cancer Res 37:646–650 - PubMed
    1. Jahr S, Hentze H, Englisch S et al (2001) DNA fragments in the blood plasma of cancer patients: quantitations and evidence for their origin from apoptotic and necrotic cells. Cancer Res 61:1659–1665 - PubMed
    1. Stroun M, Anker P, Maurice P, Lyautey J, Lederrey C, Beljanski M (1989) Neoplastic characteristics of the DNA found in the plasma of cancer patients. Oncology 46:318–322. 10.1159/000226740 - PubMed

Substances

LinkOut - more resources