. 2025 Nov 3;31(21):4571-4585.
doi: 10.1158/1078-0432.CCR-25-0534.

The Novel Immunocompetent Eµ-SOX11CCND1 Mouse Model Phenotypically and Molecularly Resembles Human Mantle Cell Lymphoma

Affiliations

The Novel Immunocompetent Eµ-SOX11CCND1 Mouse Model Phenotypically and Molecularly Resembles Human Mantle Cell Lymphoma

Hedieh Jafari et al. Clin Cancer Res. .

Abstract

Purpose: Mantle cell lymphoma (MCL) remains incurable despite therapeutic advances, highlighting the need for improved preclinical models. Existing transgenic MCL mouse models have significant limitations, restricting their translational value.

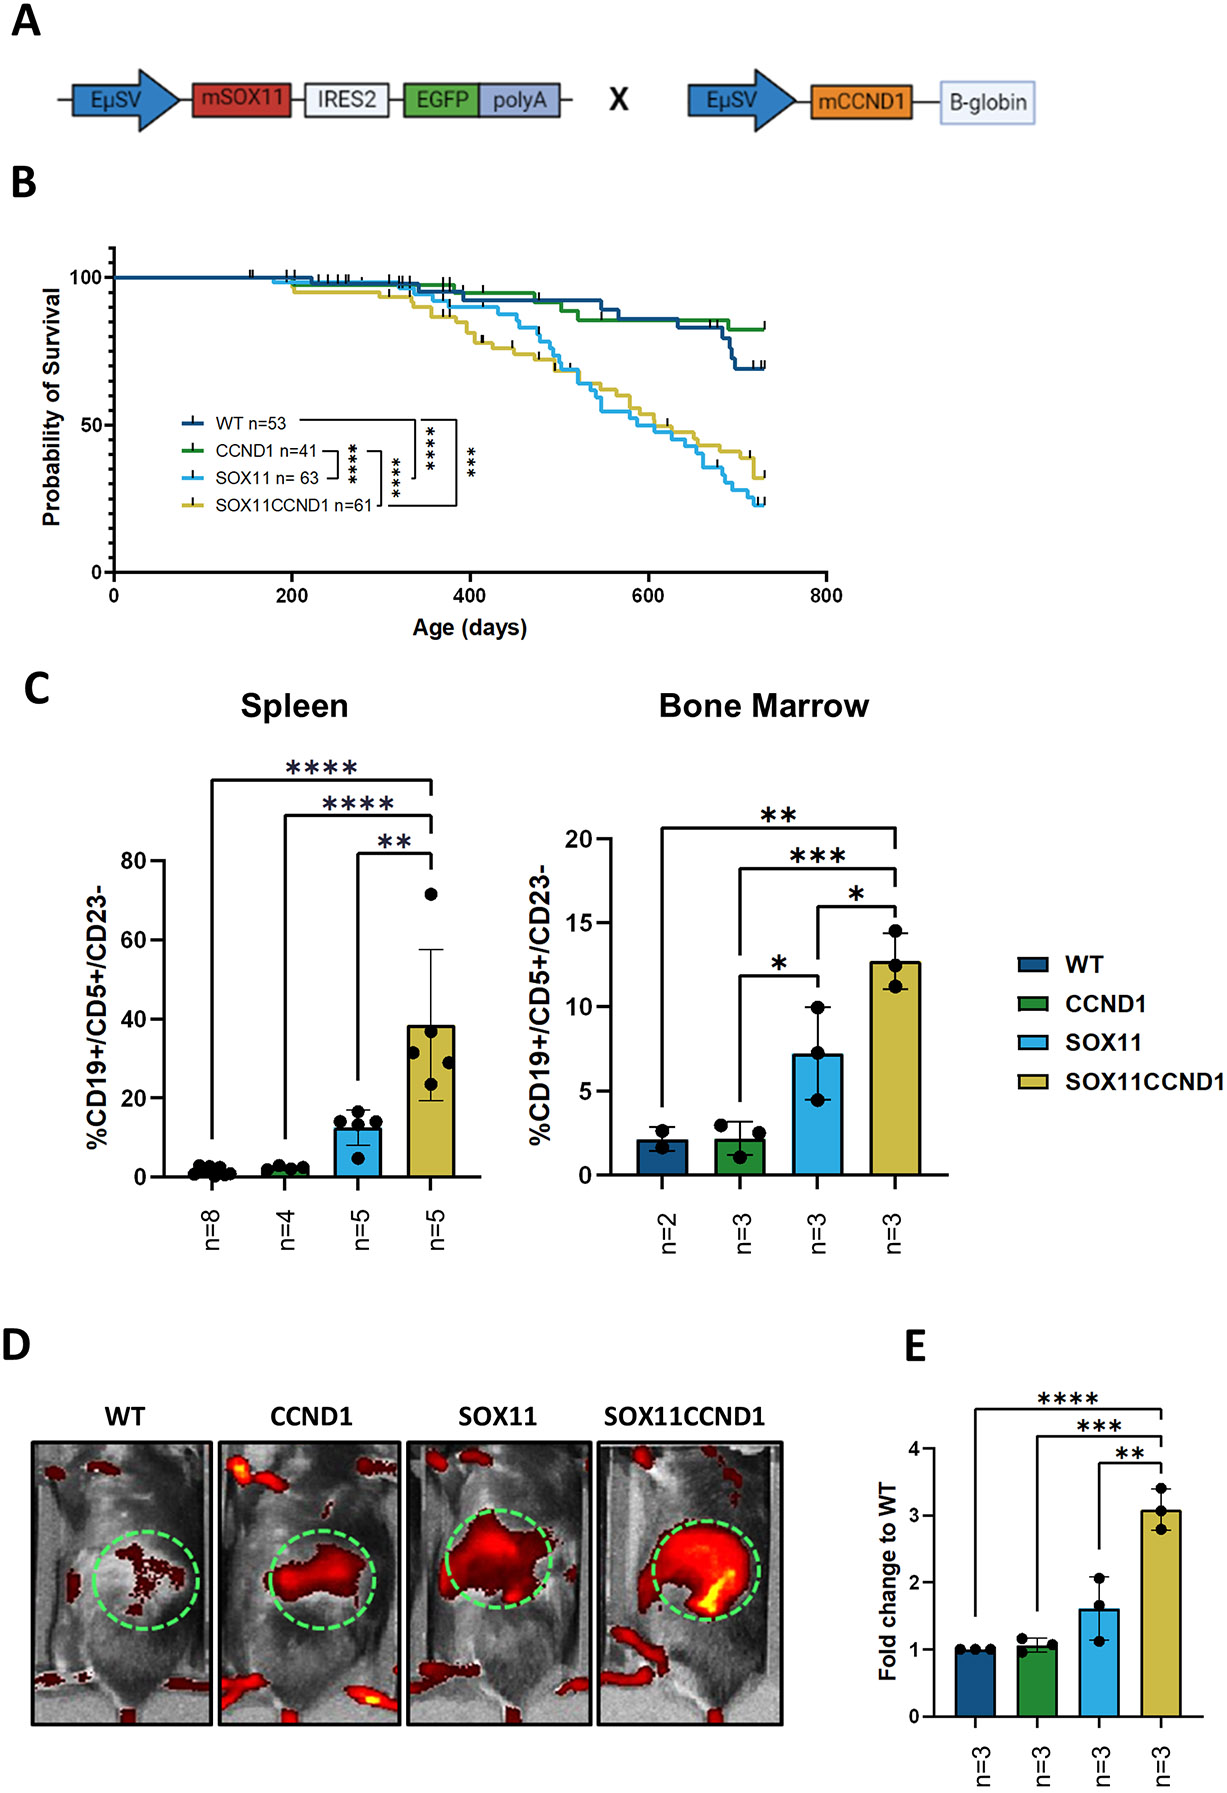
Experimental design: We generated an immunocompetent MCL model by overexpressing the key oncogenic drivers SRY-box transcription factor 11 (SOX11) and Cyclin D1 (CCND1) under the Eµ enhancer in C57BL/6 mice, aiming to replicate human MCL's biological and pathologic features.

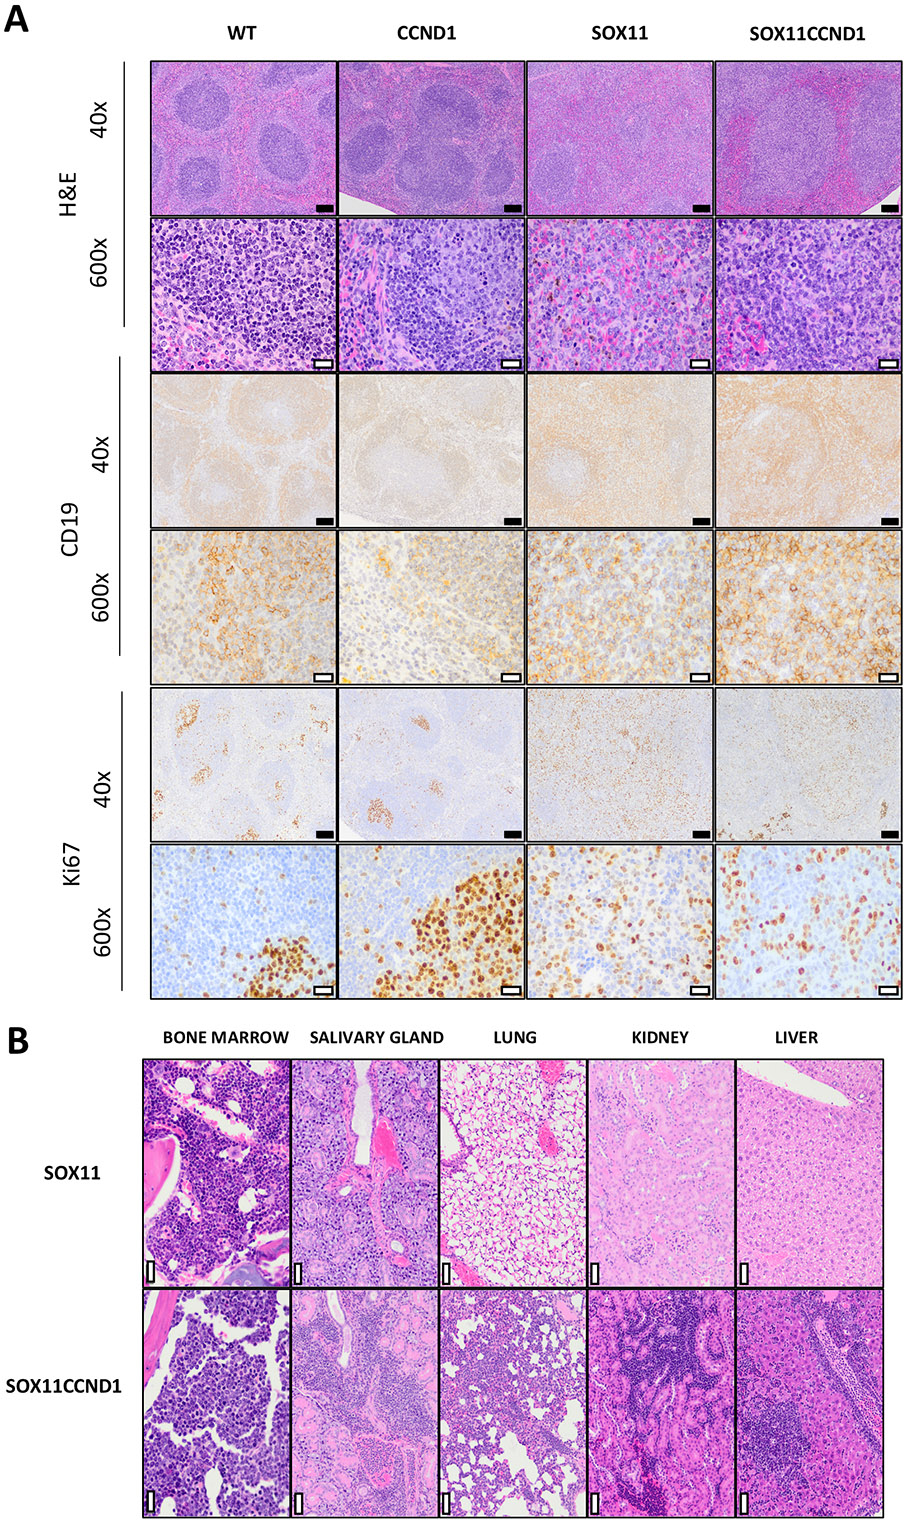
Results: Eµ-SOX11CCND1 mice developed lymphoma marked by clonal B1a cell expansion in lymphatic and extranodal tissues. Morphologic, immunophenotypic, and transcriptional profiling revealed strong similarity to human MCL, with pathway analysis confirming significant molecular overlap. Importantly, lymphoma cells could be adoptively transferred into wild-type recipients, enabling therapeutic testing within an intact immune system.

Conclusions: The Eµ-SOX11CCND1 mouse represents a robust and biologically relevant model that faithfully recapitulates human MCL. Its immunocompetent nature and adoptive transfer capability make it a valuable model for studying disease mechanisms and evaluating novel therapeutic approaches for patients with MCL.


Conflict of interest statement

Disclosure of Conflicts of Interest

Employment: K.V. and P.S. are employees of Prelude Therapeutics

Stock: K.V. And P.S. have stock in Prelude Therapeutics

Research Support: R.A.B received research support from Prelude Therapeutics

S.P. has research support from Amgen, Celgene/Bristol Myers Squibb Corporation, Regeneron, Genentech, imCORE, Caribou and is a consultant for Grail (advisory board)

Figures

Figure 1.
Figure 1.. SOX11 and CCND1 overexpression induces proliferation of a MCL-like population.
(A) Schematic illustration of gene cassettes for the co-expression of SOX11 and CCND1 transgenes. (B) Kaplan-Meier curve showing a significant survival disadvantage for the Eμ-SOX11 and Eμ-SOX11CCND1 animals compared to wild type (WT) and single transgenic CCND1 mice. (C) Histograms showing significant expansion of MCL-like CD19+/CD5+/CD23 of CD45+ in singlet-viable cells from spleen and bone marrow from Eμ-SOX11CCND1 mice from the aging colony compared to the other groups. (D) Representative images of the radiance of spleen in WT, Eμ-CCND1, Eμ-SOX11, and Eμ-SOX11CCND1 which are quantified as fold change to WT radiant efficiency, expressed as p/sec/cm2/sr/ μW/cm2 in €. To determine significance, a mantle cox regression was used in B and a one-way ANOVA was used in C and E. WT: CCND1 and SOX11:SOX11CCND1 are ns in B. Error bars show standard deviation. * p<0.05 ** p<0.01 *** p<0.001 **** p<0.0001
Figure 2.
Figure 2.. SOX11 and CCND1 overexpression results in the expansion of an MCL-like population resembling human MCL.
(A) Histopathologic analysis and immunohistochemical features of MCL-like disease observed in Eμ-SOX11CCND1 mice. As compared to normal splenic follicular architecture seen in the spleens of WT and Eμ-CCND1 mice with well-defined CD19+ follicles, there is widespread effacement of normal architecture by sheets of CD19+ B cells in the Eμ-SOX11 and Eμ-SOX11CCND1 mice. Additionally, compared to Ki67 immunoreactivity in the WT and Eμ-CCND1 spleens, which is confined to germinal centers, significant diffuse Ki67 immunoreactivity is noted in the spleens of Eμ-SOX11 and Eμ-SOX11CCND1 mice. (B) Extranodal involvement in a representative Eμ-SOX11CCND1 mouse (202) that reached ERC. In addition to infiltration and effacement of the spleen and lymph nodes, MCL-like infiltrates were seen in the vasculature and parenchyma of the kidney, lung, salivary gland, and bone marrow. In comparison, extranodal involvement was not observed in a representative Eμ-SOX11mouse (412) that reached ERC. For photomicrographs taken at 40x, the black scale bar = 100μM. For those taken at 600x, the white scale bar = 20μM. To determine significance, a mantle cox regression was used in A. SOX11:SOX11CCND1 are ns in A. * p<0.05 ** p<0.01 *** p<0.001 **** p<0.0001
Figure 3.
Figure 3.. Lymphoma cells from the Eμ-SOX11CCND1 model can be adoptively transferred into WT recipients.
(A) schematic representation of adoptive transfer (AT) experiment isolation of lymphoma cells from a Eμ-SOX11CCND1 mouse with spontaneous lymphoma at ERC to systemic engraftment after irradiation for passage 1 and 2, and engraftment without irradiation for passage 3 and 4 (Created in BioRender. Jafari, H. (2025) https://BioRender.com/r20n991). (B) Time to ERC in WT recipients with subsequent passages (from >600 days in the donor mouse to ~25 days in passage four with systemic engraftment). (C) Kaplan-Meier survival curve of AT mice based on systematic (n=9) vs. subcutaneous (n=5, Subq) engraftment. Subq engraftment delayed ERC by an average of 5 days (17 vs. 22, p<0.01) (D) Representative UMAPs from spectral flow cytometry analysis showing the major immune cell subsets in the spleen of a WT animal and two AT-SOX11CCND1 mice (subcutaneously and systemically engrafted). The subcutaneously engrafted mouse was sacrificed on day 17 and the systemically mouse on day 18. To determine significance a mantle cox regression used in C.* p<0.05 ** p<0.01 *** p<0.001 **** p<0.0001
Figure 4.
Figure 4.. Immune profiling shows PD1/PDL1 driven immunosuppression in aging Eμ-SOX11CCND1 and AT mice.
(A) PD1 expression in CD8+ T cells isolated from the peripheral blood, spleen, and bone marrow of Eμ-SOX11CCND1 animals from the aging colony compared to age-matched WT mice. (B) PD1 expression in CD4+ T cells isolated from the peripheral blood, spleen, and bone marrow of Eμ-SOX11CCND1 animals from the aging colony compared to age-matched WT mice. (C, D) PD1 and PDL1 heatmaps on UMAP diagrams from an aging Eμ-SOX11CCND1 mouse (C) and an AT mouse (D) show expression of both markers on lymphoma cells. (E) The plot of PDL1 expression intensity and its correlation with tumor burden measured as the percentage of lymphoma cells in the peripheral blood of Eμ-SOX11CCND1 mice (R2=0.5741, p<0.0011). Multiple T-tests with Holm-Šídák correction determined statistical significance for multiple comparisons in A and B. A simple linear regression was used for E. Error bars show standard deviation. * p<0.05 ** p<0.01 *** p<0.001 **** p<0.0001
Figure 5.
Figure 5.. SOX11 and CCND1 overexpression lead to clonal expansion of B cells with a human MCL-like gene signature.
(A) IgH locus clonality analysis comparing AT-SOX11CCND1 passage 1 (P1, n=3) lymphoma cells with WT splenic CD19+ B cells (WT, n=3) showing clonal expansion of the B cells after AT in P1-4 and P1-5. (B) Volcano plot presenting the differentially expressed genes (DEGs) of P1 VS WT. SOX11 and CCND1 are shown as significantly DEGs in this comparison. (C) A heat map showing the top 50 DEGs between P1 and WT. Most of the highly DEGs in P1 are known to play a role in human MCL cell cycle dysregulation and are relevant to MCL pathogenesis/progression. (D) Heat map showing the upregulation of proliferation genes in P1 compared to WT using the human MCL proliferation gene signature.
Figure 6.
Figure 6.. Targeting critical MCL pro-survival pathways with small molecule inhibitors provides anti-lymphoma activity in the Eμ-SOX11CCND1 mouse model.
(A) Kaplan-Meier curve showing significant and dose-dependent survival advantage for AT Eμ-SOX11CCND1 animals treated with PRT382 compared to vehicle control. (B, C) Kaplan-Meier curve showing a significant survival advantage for AT Eμ-SOX11CCND1 animals treated with venetoclax or ibrutinib compared to vehicle control. The black circle in (C) indicates the mouse used to generate an acquired ibrutinib resistance by re-passaging cells while keeping the animals on continuous ibrutinib treatment (D, E). A mantle cox regression was used for all plots to determine the significance. * p<0.05 ** p<0.01 *** p<0.001 **** p<0.0001

References

    1. Schieber M, Gordon LI, Karmali R. Current overview and treatment of mantle cell lymphoma. F1000Research. 2018;7.
    1. Saba NS, Liu D, Herman SE, Underbayev C, Tian X, Behrend D, et al. Pathogenic role of B-cell receptor signaling and canonical NF-κB activation in mantle cell lymphoma. Blood, The Journal of the American Society of Hematology. 2016;128(1):82–92.
    1. Wang M, Munoz J, Goy A, Locke FL, Jacobson CA, Hill BT, et al. KTE-X19 CAR T-cell therapy in relapsed or refractory mantle-cell lymphoma. New England journal of medicine. 2020;382(14):1331–1342. - PMC - PubMed
    1. Martin P, Maddocks K, Leonard JP, Ruan J, Goy A, Wagner-Johnston N, et al. Postibrutinib outcomes in patients with mantle cell lymphoma. Blood, The Journal of the American Society of Hematology. 2016;127(12):1559–1563.
    1. Dreyling M, Aurer I, Cortelazzo S, Hermine O, Hess G, Jerkeman M, et al. Treatment for patients with relapsed/refractory mantle cell lymphoma: European-based recommendations. Leukemia & lymphoma. 2018;59(8):1814–1828. - PubMed