. 2025 Sep 16;6(9):102310.
doi: 10.1016/j.xcrm.2025.102310. Epub 2025 Aug 25.

An age-related decrease in leptin contributes to CD8+ T cell aging in the tumor microenvironment

Affiliations

An age-related decrease in leptin contributes to CD8+ T cell aging in the tumor microenvironment

Feixiang Wang et al. Cell Rep Med. .

Abstract

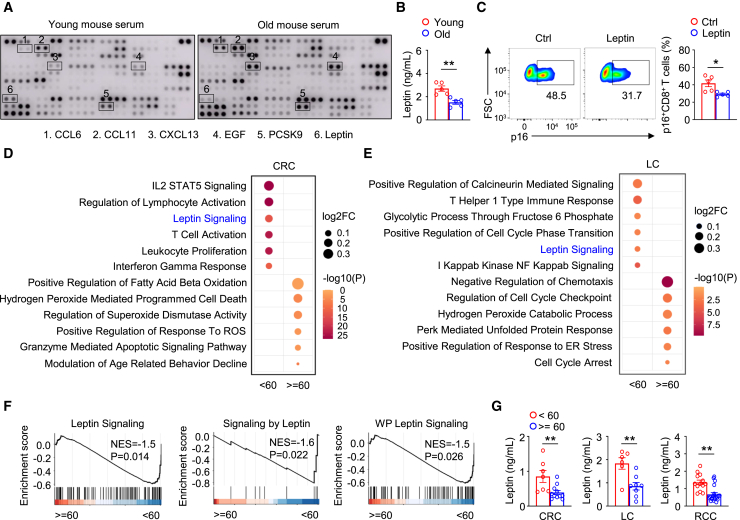
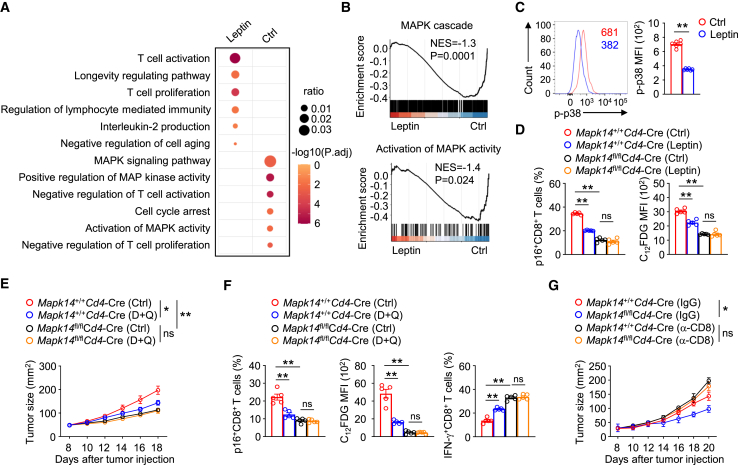
T cell dysfunction with age underlies an increased incidence of cancer in elderly individuals; however, how T cell aging is triggered in the tumor microenvironment is unclear. Here, we show that an age-associated reduction in adipocyte-derived leptin contributes to the accumulation of tumor-infiltrating senescent CD8+ T cells. Single-cell profiling of human and mouse cancer tissues reveals that the frequency of intratumoral senescent CD8+ T cells increases with age, leading to a weak antitumor effect. Moreover, decreased levels of adipocyte-derived leptin are an indispensable factor for CD8+ T cell aging. Leptin signaling prevents p38-dependent CD8+ T cell senescence. Furthermore, plasma leptin levels are negatively related to intratumoral CD8+ T cell senescence in cancer patients. Our findings identify an unappreciated interplay between metabolic perturbation and T cell aging and suggest that modulating adipocyte-derived leptin levels may be a promising therapeutic strategy for older cancer patients.

Keywords: CD8(+) T cells; T cell senescence; aging; antitumor immunity; leptin.


Conflict of interest statement

Declaration of interests The authors declare no competing interests.

Figures

None
Graphical abstract
Figure 1
Figure 1
Intratumoral senescent CD8+ T cells increase with age in humans (A) Uniform manifold approximation and projection (UMAP) of tumor-infiltrating CD8+ T cells and quantitation of non-senescent and senescent CD8+ T cell subsets from patients with colorectal cancer (CRC). 11 CRC patients were enrolled in this study (n = 5 for “<60” group and n = 6 for “≥60” group). (B and C) Violin plots of senescence score (B) and CDKN2A level (C) in the non-senescent and senescent tumor-infiltrating CD8+ T cells shown in (A). (D) UMAP of top 10 frequent TCR clones (shown as red dots) in CD8+ T cells. (E) Pie charts showing the percentage of different TCR clone types in the non-senescent and senescent CD8+ T cells from patients with CRC. (ND, not detected; Single, 1 cell; Small, between 1 and 5 cells; Medium, between 5 and 20 cells; Large, between 20 and 100 cells; Hyper, more than 101 cells). (F) Inverse Simpson index representing the diversity of TCR repertoire in the non-senescent and senescent tumor-infiltrating CD8+ T cells. (G) Percentages of different TCR clone types in the non-senescent and senescent tumor-infiltrating CD8+ T cells from CRC patients. (H) Correlation between age and the percentage of p16+CD8+ T cells in tumor tissues from patients with CRC (n = 18), LC (n = 14), and renal cell carcinoma (RCC) (n = 33). Spearman’s correlation coefficient was performed (H). See also Figures S1–S3.
Figure 2
Figure 2
Intratumoral senescent CD8+ T cells increase with age in mice (A) UMAP of tumor-infiltrating CD8+ T cells and quantitation of non-senescent and senescent CD8+ T cell subsets from B16-F10 tumor-bearing C57BL/6J mice. The mice were divided into two age groups: young (6–8 weeks) and old (17–22 months). (B and C) Violin plots of senescence score (B) and Cdkn2a level (C) in the non-senescent and senescent CD8+ T cells shown in (A). (D) Flow cytometric analysis of the percentage of p16+CD8+ T cells in tumor tissues from tumor-bearing C57BL/6 mice injected with 5 × 10⁵ MC38, 1 × 10⁶ B16-F10, or 5×10⁵ LLC tumor cells (n = 5 each) aged 6- to 8-week-old (Young) and 20- to 24-month-old (Old). (E) Tumor growth curve of C57BL/6 mice after OT-I T cell transfer. 5 × 10⁵ MC38 tumor cells (inoculated into the left abdomen) and 5 × 10⁵ MC38-OVA tumor cells (inoculated into the right abdomen) were inoculated into the same C57BL/6 mouse. Subsequently, CD8+ T cells isolated from young or old OT-I mice were adoptively transferred into the tumor-bearing C57BL/6 mice at day 7 after tumor injection (n = 6). (F and G) Flow cytometric analysis of p16+ (F) and IFN-γ+ and Ki-67+ (G) OT-I T cells in tumor tissues at day 20 after tumor injection. Tumor-infiltrating lymphocytes were stimulated with OVA257-264 and monensin for 6 h for analysis (n = 5). (H) Clusters of tumor-infiltrating CD8+ T cell types and quantitation of non-senescent and senescent CD8+ T cells from tumor-bearing mice (4–6 months) injected with 5 × 10⁵ MC38 tumor cells after D + Q treatment. (I) Flow cytometric analysis of the percentage of p16+CD8+ T cells in MC38 tumor-bearing mice (4–6 months) after D + Q treatment (n = 5). Data are representative of three independent experiments and shown as the mean ± SEM. p values were determined by two-tailed Student’s t test (D, G, and I), two-way ANOVA (E), and one-way ANOVA (F). ∗∗p < 0.01; ns, not statistically significant. See also Figure S4.
Figure 3
Figure 3
Aging results in a significant reduction in systemic leptin (A) Serum samples were collected for cytokine assay at day 7 after tumor injection from C57BL/6 WT mice injected subcutaneously (s.c.) with 5 × 10⁵ MC38 tumor cells. The mice were divided into two age groups: young (6–8 weeks) and old (20–24 months). (B) ELISA analysis of serum leptin from C57BL/6 WT mice injected s.c. with 5 × 10⁵ MC38 tumor cells at day 7. The mice were divided into two age groups: young (6–8 weeks, n = 5) and old (20–24 months, n = 5). (C) Flow cytometric analysis of the expression of p16 in tumor cell-polarized senescent CD8+ T cells upon leptin treatment in vitro (n = 5). CD8+ T cells isolated from p16-EGFP mice were stimulated with anti-CD3 and anti-CD28 for 24 h and then cocultured with B16-F10 tumor cells for 24 h. These stimulated CD8+ T cells were further treated with leptin for 48 h. (D and E) Gene ontology enrichment analysis of gene sets in tumor-infiltrating senescent CD8+ T cells from patients with CRC (D) and LC (E). (F) Gene set enrichment analysis (GSEA) enrichment plot of indicated pathways in senescent CD8+ T cells from LC patients. (G) ELISA analysis of serum leptin from patients with CRC (n = 18), LC (n = 14), and RCC (n = 33). Data are representative of three independent experiments and shown as the mean ± SEM. p values were determined by two-tailed Student’s t test (B, C, and G). ∗p < 0.05; ∗∗p < 0.01. See also Figure S5.
Figure 4
Figure 4
Age-related decline in leptin promotes CD8+ T cell senescence (A and B) Tumor growth curve (A) and survival curve (B) of Lepr+/+Cd4-Cre and Leprfl/flCd4-Cre mice aged 3–4 months injected subcutaneously (s.c.) with 5 × 10⁵ MC38 tumor cells (n = 8). (C and D) Flow cytometric analysis of the expression of p16, the level of C12FDG (a lipophilic green fluorescent substrate used to detect the activity of β-galactosidase), and the percentage of IFN-γ in tumor-infiltrating CD8+ T cells from Lepr+/+Cd4-Cre and Leprfl/flCd4-Cre mice aged 3–4 months injected s.c. with MC38 tumor cells (n = 5). (E and F) Tumor growth curve (E) and survival curve (F) of 20- to 24-month-old C57/BL6 mice injected s.c. with 5 × 10⁵ MC38 tumor cells followed by intraperitoneal injection with leptin daily (n = 7). Ctrl, control mice. (G) Flow cytometric analysis of the expression of p16, the level of C12FDG, and the percentage of IFN-γ in tumor-infiltrating CD8+ T cells from 20- to 24-month-old C57/BL6 mice injected s.c. with MC38 tumor cells followed by intraperitoneal injection with leptin daily (n = 6). (H) Tumor growth curve of 20- to 24-month-old C57/BL6 mice s.c. injected with 2 × 10⁵ MC38 tumor cells. These mice were intraperitoneally (i.p.) treated with leptin daily and α-CD8 at days 6, 9, and 12 after tumor injection (n = 7). Data are representative of three independent experiments and shown as the mean ± SEM. p values were determined by two-way ANOVA (A, E, and H), log rank tests (B and F), and two-tailed Student’s t test (D and G). ∗p < 0.05; ∗∗p < 0.01; ns, not statistically significant.
Figure 5
Figure 5
Leptin signaling prevents p38-dependent CD8+ T cell senescence (A) Gene ontology enrichment analysis of gene sets in tumor cell-polarized senescent GFP+CD8+ T cells upon leptin treatment in vitro. CD8+ T cells were isolated from p16-EGFP mice and were polarized in vitro for RNA-seq. (B) Gene set enrichment analysis (GSEA) enrichment plot of indicated pathways in tumor cell-polarized senescent GFP+CD8+ T cells upon leptin treatment in vitro. (C) Flow cytometric analysis of the level of p-p38 in tumor cell-polarized senescent GFP+CD8+ T cells upon leptin treatment in vitro (n = 6). (D) Flow cytometric analysis of the expression of p16 and the level of C12FDG of tumor cell-polarized senescent Mapk14+/+Cd4-Cre and Mapk14fl/flCd4-Cre CD8+ T cells upon leptin treatment in vitro (n = 5). (E) Tumor growth curve of Mapk14+/+Cd4-Cre and Mapk14fl/flCd4-Cre mice aged 3–4 months injected subcutaneously (s.c.) with 5 × 10⁵ MC38 cancer cells followed by oral gavage with D + Q (n = 6 or 7). (F) Flow cytometric analysis of the percentage of p16, the level of C12FDG, and the percentage of IFN-γ in tumor-infiltrating CD8+ T cells from tumor-bearing Mapk14+/+Cd4-Cre and Mapk14fl/flCd4-Cre mice treated with D + Q (n = 5). (G) Tumor growth curve of Mapk14+/+Cd4-Cre and Mapk14fl/flCd4-Cre mice injected with 2 × 10⁵ MC38 tumor cells and treated with IgG or α-CD8 intraperitoneally (i.p.) at days 6, 9, and 12 after tumor injection (n = 6). Data are representative of three independent experiments and shown as the mean ± SEM. Two-tailed Student’s t test (C), one-way ANOVA (D and F), and two-way ANOVA (E and G) were performed. ∗p < 0.05; ∗∗p < 0.01; ns, not statistically significant.
Figure 6
Figure 6
Adipocyte-derived leptin levels decrease with age (A) UMAP of indicated cell subsets from human white adipose tissues (WATs) in the database GSE176171. (B and C) UMAP plots (B) and statistical analysis (C) showing the transcriptional level of LEPTIN in WATs from two groups of individuals (Young, <60 years; Old, ≥60 years). (D) ELISA analysis of serum leptin from young mice (3–4 months) at day 14 after eWAT surgical removal (n = 4). (E) Tumor growth curve of tumor-bearing mice (3–4 months) injected with 5 × 10⁵ MC38 tumor cells that had undergone either sham surgery (Sham) or removal of eWAT (eWAT×) (n = 8). (F) Flow cytometric analysis of the expression of p16, the level of C12FDG, and the percentage of IFN-γ in tumor-infiltrating CD8+ T cells from MC38-cell-challenged mice (3–4 months) that had undergone either sham surgery (Sham) or removal of eWAT (eWAT×) (n = 4). (G) Tumor growth curve of tumor-bearing mice (3–4 months) injected with 2 × 10⁵ MC38 tumor cells undergone either sham surgery (Sham) or removal of eWAT (eWAT×). These mice were treated intraperitoneally with IgG or α-CD8 at days 6, 9, and 12 after tumor injection (n = 7). (H) ELISA analysis of serum leptin from aged mice (20–24 months) at day 14 after orlistat treatment (n = 4). (I) Tumor growth curve of control (Ctrl) and orlistat-treated 20- to 24-month-old mice injected with 2 × 10⁵ MC38 tumor cells (n = 10 for Ctrl; 9 for orlistat). (J) Flow cytometric analysis of the percentage of p16, the level of C12FDG, and the percentage of IFN-γ in tumor-infiltrating CD8+ T cells from MC38-cell-challenged orlistat-treated 20- to 24-month-old mice (n = 5). (K) Tumor growth curve of Ctrl or orlistat-treated 20- to 24-month-old mice injected with 2 × 10⁵ MC38 tumor cells. These mice were treated intraperitoneally with IgG or α-CD8 at days 6, 9, and 12 after tumor injection (n = 6). Data are representative of three independent experiments and shown as the mean ± SEM. p values were determined by two-tailed Student’s t test (D, F, H, and J) and two-way ANOVA (E, G, I, and K). ∗p < 0.05; ∗∗p < 0.01; ns, not statistically significant. See also Figures S6 and S7.
Figure 7
Figure 7
Intratumoral CD8+ T cell senescence is negatively related to plasma leptin levels in cancer patients (A) Plasma leptin concentration from RCC patients was determined by ELISA (n = 33). (B and C) Correlation between plasma leptin and age (B) and the percentage of p16+CD8+ T cells in tumor tissues (C) from RCC patients (n = 33). (D and E) Correlation between plasma leptin and age (D) and the percentage of p16+CD8+ T cells in tumor tissues (E) from LC patients (n = 14). (F) Plasma leptin concentration from CRC patients was determined by ELISA (n = 18). (G and H) Correlation between plasma leptin and age (G) and the percentage of p16+CD8+ T cells in tumor tissues (H) from CRC patients (n = 18). (I) Correlation between BMI and plasma leptin (left) and the percentage of p16+CD8+ T cells in tumor tissues (right) from RCC patients aged 50 years or older (n = 30). (J) Correlation between BMI and plasma leptin (left) or the percentage of p16+CD8+ T cells in tumor tissues (right) from CRC patients aged 50 years or older (n = 15). Spearman’s correlation coefficient was performed (B, C, D, E, and G–J). Pearson correlation R square (R2) values, significance (p), and regression lines are shown.

References

    1. Han S., Georgiev P., Ringel A.E., Sharpe A.H., Haigis M.C. Age-associated remodeling of T cell immunity and metabolism. Cell Metab. 2023;35:36–55. doi: 10.1016/j.cmet.2022.11.005. - DOI - PMC - PubMed
    1. Mittelbrunn M., Kroemer G. Hallmarks of T cell aging. Nat. Immunol. 2021;22:687–698. doi: 10.1038/s41590-021-00927-z. - DOI - PubMed
    1. Schreiber R.D., Old L.J., Smyth M.J. Cancer immunoediting: integrating immunity's roles in cancer suppression and promotion. Science. 2011;331:1565–1570. doi: 10.1126/science.1203486. - DOI - PubMed
    1. Waldman A.D., Fritz J.M., Lenardo M.J. A guide to cancer immunotherapy: from T cell basic science to clinical practice. Nat. Rev. Immunol. 2020;20:651–668. doi: 10.1038/s41577-020-0306-5. - DOI - PMC - PubMed
    1. Fan H., Xia S., Xiang J., Li Y., Ross M.O., Lim S.A., Yang F., Tu J., Xie L., Dougherty U., et al. Trans-vaccenic acid reprograms CD8(+) T cells and anti-tumour immunity. Nature. 2023;623:1034–1043. doi: 10.1038/s41586-023-06749-3. - DOI - PMC - PubMed