. 2025 Aug 26;16(1):649.
doi: 10.1038/s41419-025-07960-y.

Tumor-derived PRMT1 suppresses macrophage antitumor activity by inhibiting cGAS/STING signaling in gastric cancer cells

Affiliations

Tumor-derived PRMT1 suppresses macrophage antitumor activity by inhibiting cGAS/STING signaling in gastric cancer cells

Hui Wang et al. Cell Death Dis. .

Abstract

Gastric cancer (GC) is a common and aggressive malignancy worldwide. Increasing evidence has shown that epigenetic changes are closely related to the development of cancer and tumor-associated macrophages. Here, we report that PRMT1 is a key immunosuppressive factor in GC. PRMT1 is upregulated in GC and promotes tumor progression. PRMT1 knockdown in GC leads to the activation of the cGAS/STING pathway through the enhancement of dsDNA aggregation, which subsequently increases IFN-β secretion. Notably, after PRMT1 knockdown, M1-like tumor-associated macrophage (TAM) infiltration increased, whereas M2-like TAM infiltration decreased in vivo and in vitro. After the targeted inhibition of STING by siRNA or H151, the improvement in the progression of GC caused by PRMT1 knockdown decreased, and the changes in macrophage polarization were reversed. Furthermore, we found that PRMT1 knockdown in GC affects the STAT pathway in TAMs, inducing changes in their polarization and promoting GC apoptosis by enhancing IFN-β secretion through the cGAS/STING pathway. In summary, our findings revealed that PRMT1 knockdown inhibits the cGAS/STING pathway in GC, which produces type I IFNs to promote the polarization of M1-like macrophages in the tumor microenvironment.


Conflict of interest statement

Competing interests: The authors declare no competing interests.

Figures

Fig. 1
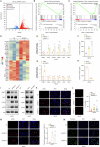
Fig. 1. Clinical expression, prognostic value and cancer promoting functions of PRMT1 in GC.
A Heatmap of PRMTs family (left) and its expressions (right) from RNA-seq in 4 pairs of cancer and paracancer tissue in GC patients. B-C Public database-based analysis depicted PRMT1 mRNA expression in cancer and normal tissues of GC patients through RNA-seq data and Gene Chip data. D Kaplan-Meier curves of overall survival in 945 patients with GC, stratified by PRMT1 expression (Log-rank test, P = 0.00043) (https://kmplot.com/analysis/index.php?p=service&cancer=gastric). E, F Representative microphotographs of IHC staining (E) and IHC scores (F) for PRMT1 in a tissue chip with GC and paired para-tumor normal tissues from the clinic. Magnification: 10 × and 400 ×. G Kaplan-Meier curves of overall survival in 53 patients with GC in the tissue chip, stratified by PRMT1 expression (Log-rank test, P = 0.0007). H-I PRMT1 expression levels of HGC27 after lentivirus interference detected by Western blots (H) and qRT-PCR (I). J-K Flow cytometry analysis of the apoptotic cells after depletion of PRMT1 in HGC27 cells using the Annexin V-APC/PI staining assay (J). Positive Annexin V cells were displayed as a histogram (K). L The proliferation rates of HGC27 cells upon depletion of PRMT1 were determined by CCK8 assay. (M) Western blots detected protein levels of PRMT1 and cleaved caspase-3 in HGC27 after down-expressing PRMT1. N Resected tumors formed in nude mice injected with the indicated cells from each group (n = 3) were photographed. O-P The volumes and weights of resected tumors from each mouse were recorded. Q-S Representative images of IHC staining (Q) and IHC scores (R-S) of PRMT1 and cleaved caspase-3 in resected tumors from nude mice. *P < 0.05, **P < 0.01, ***P < 0.001, ****P < 0.0001.
Fig. 2
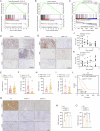
Fig. 2. PRMT1 knockdown triggered an antitumor response via the activation of cGAS/STING signaling.
A The volcano chart of HGC27 cells after PRMT1 knockdown (blue: 3501 down-regulated genes; red: 3829 upregulated genes). B, C GSEA plots for cytosolic DNA-sensing pathway (B) and type I IFN production (C) related genes in HGC27 cells following knocking down PRMT1. D Heatmap of the top 15 upregulated and down-regulated genes in HGC27 cells after PRMT1 knockdown. The data presented was normalized by log2. E The mRNA expression of CGAS, STING1, IFNB1, TBK1, and IRF3 in HGC27 cells after PRMT1 knockdown. F The expression levels of IFN-β in the secretion of HGC27 cells after PRMT1 knockdown were detected by ELISA. G The mRNA expression of CGAS, STING1, IFNB1, TBK1, and IRF3 in HGC27 cells after PRMT1 overexpression. H The expression levels of IFN-β in the secretion of HGC27 cells after PRMT1 overexpressed were detected by ELISA. I, J Protein levels of PRMT1, p-TBK1, and p-IRF3 in HGC27 cells after PRMT1 was downregulated (I) or up-regulated (J) were detected by Western blot. K For immunofluorescent staining, HGC27 cells were stained with anti-γH2AX antibody (red) and counter-stained with DAPI (blue) after PRMT1 was downregulated. Magnification: 200 ×. L Representative images of the comet assay of HGC27 cells after PRMT1 was downregulated. Magnification: 100 ×. M For immunofluorescent staining, HGC27 cells were stained with anti-dsDNA antibody (red) and counter-stained with DAPI (blue) after PRMT1 was downregulated (left). Relative fluorescence intensity of dsDNA to DAPI was displayed as a histogram (right). Magnification: 200 ×. N Representative images of HGC27 cells using PicoGreen (green) and DAPI (blue). Magnification: 200 ×. *P < 0.05, **P < 0.01, ***P < 0.001, ****P < 0.0001.
Fig. 3
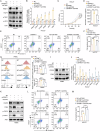
Fig. 3. Clinical expression and prognostic value of M1 and M2 macrophages in GC, especially the relationship between PRMT1 expression and M1 and M2 macrophages in GC.
A, B GSEA plots for macrophage M1 vs. M2-up (A) and immune response (B) related genes from RNA-seq in 4 pairs of cancer and paracancer tissue in GC patients. C GSEA plots for immune response related genes in HGC27 cells following knocking down PRMT1. DF The changes in the infiltration of CD86+ and CD206+ macrophages in a tissue chip with GC and paired para-tumor normal tissues from the clinic. Representative images after staining (D) and statistical analysis of the CD86+ and CD206+ cells per area (E, F). Magnification: 400 ×. GI The changes in the infiltration of CD86+ and CD206+ macrophages in PRMT1-High and PRMT1-Low groups in a tissue chip with GC and paired para-tumor normal tissues from the clinic. Representative images after staining (G) and statistical analysis of the CD86+ and CD206+ cells per area (H, I). Magnification: 400 ×. J, K Correlation analysis of PRMT1 and CD86+ or CD206+ cells per area based on IHC. (L) Kaplan-Meier curves of overall survival in 53 patients with GC in the tissue chip, stratified by CD86+ cells per area (Log-rank test, P = 0.0162). MO Representative images of IHC staining (M) and positive cells per area (N-O) of CD86+ and CD206+ cells in resected tumors from nude mice in NC and shPRMT1 groups. Magnification: 400 ×. *P < 0.05, **P < 0.01, ***P < 0.001, ****P < 0.0001.
Fig. 4
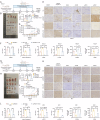
Fig. 4. PRMT1 knockdown leads to increased infiltration and polarization of M1-like TAMs in GC to improve antitumor ability.
A, B Schematic of the coculture of gastric cancer cells with PBMCs (A) or BMDMs (B) in the chamber system. CE PBMCs from the coculture system with HGC27 cells, depleted or not depleted of PRMT1, and analyzed by flow cytometry with anti-CD86 and anti-CD206 antibodies (C). The ratio of MFI of CD86+ cells (D) and CD206+ cells (E) is shown. MFI mean fluorescence intensity. FH BMDMs from the coculture system with MFC cells, depleted or not depleted of PRMT1, and analyzed by flow cytometry with anti-CD86 and anti-CD206 antibodies (F). The ratio of MFI of CD86+ cells (G) and CD206+ cells (H) is shown. I, J mRNA levels of M1 and M2 macrophage markers in PBMCs (I) and BMDMs (J) from the coculture system with GC cells after PRMT1 knockdown were detected by qRT-PCR. K Protein levels of CD86 and CD206 in PBMCs (left) and BMDMs (right) from the coculture system with GC cells after PRMT1 knockdown were detected by Western blot. L, M Flow cytometry analysis of the apoptotic HGC27 cells after depletion of PRMT1 from the coculture system with PBMCs using the Annexin V-APC/PI staining assay (L). Positive Annexin V cells were displayed as a histogram (M). N, O Flow cytometry analysis of the apoptotic MFC cells after depletion of PRMT1 from the coculture system with BMDMs using the Annexin V-APC/PI staining assay (N). Positive Annexin V cells were displayed as a histogram (O). *P < 0.05, **P < 0.01, ***P < 0.001, ****P < 0.0001.
Fig. 5
Fig. 5. PRMT1 knockdown-induced antitumor properties and polarization of M1-like macrophages through STAT signaling were abolished after inhibition of cGAS/STING signaling.
A Expression levels of p-TBK1 and p-IRF3 after PRMT1 or (and) STING knockdown were detected by Western blot in HGC27. B Expression levels of CGAS, STING, IFN-α, TBK1, and IRF3 after PRMT1 or (and) STING knockdown were detected by qRT-PCR in HGC27. C The proliferation rates of HGC27 cells upon depletion of PRMT1 or (and) STING determined by CCK8 assay. D The expression levels of IFN-β in the secretion of HGC27 cells after depletion of PRMT1 or (and) STING detected by ELISA. E, F Flow cytometry analysis of the apoptotic cells after depletion of PRMT1 or (and) STING in HGC27 cells using the Annexin V-APC/PI staining assay (E). Positive Annexin V cells were displayed as a histogram (F). G, H PBMCs from the coculture system with HGC27 cells depleted or not depleted of PRMT1 or (and) STING and analyzed by flow cytometry with anti-CD86 and anti-CD206 antibodies (G). The ratio of MFI of CD86+ cells (D) and CD206+ cells (H) is shown. I Western blots detected protein levels of CD86 and CD206 in PBMCs from the coculture system with HGC27 cells depleted of PRMT1 or (and) STING. J mRNA levels of M1 and M2 macrophage markers in PBMCs from the coculture system with HGC27 cells after PRMT1 or (and) STING knockdown detected by qRT-PCR. K Western blots detected protein levels of CD86, CD206, p-STAT1, and p-STAT2 in PBMCs from coculture system with HGC27 cells depleted of PRMT1 or (and) STING. L, M Flow cytometry analysis of the apoptotic HGC27 cells after depletion of PRMT1 or (and) STING in HGC27 cells from the coculture system with PBMCs using the Annexin V-APC/PI staining assay (L). Positive Annexin V cells were displayed as a histogram (M). *P < 0.05, **P < 0.01, ***P < 0.001, ****P < 0.0001.
Fig. 6
Fig. 6. STING inhibitor H151 enhanced the anticancer effect in PRMT1-deficient GC in vivo.
A Schematic of the H151 treatment schedule in the xenograft gastric cancer model (injection of HGC27 cells with control group and PRMT1 knockdown group). BD Tumor macroscopical images (B), tumor weights (C) and volumes (D) at the end of the experiments in the shPRMT1 and NC groups with or without H151 treatment. E Representative microphotographs of IHC staining of PRMT1, cleaved caspase-3, p-TBK1, p-IRF3, CD86+, and CD206+ cells in the upper 4 groups. F H score of PRMT1, cleaved caspase-3, p-TBK1, and p-IRF3, and positive cells per area of CD86+ and CD206+ cells in the upper 4 groups. Magnification: 400 ×. G Schematic of the H151 treatment schedule in the xenograft gastric cancer model (injection of MFC cells with control group and PRMT1 knockdown group). HJ Tumor macroscopical images (H), tumor weights (I), and volumes (J) at the end of the experiments in the shPRMT1 and NC groups with or without H151 treatment. K Representative microphotographs of IHC staining of PRMT1, cleaved caspase-3, p-TBK1, p-IRF3, CD86+, and CD206+ cells in the upper 4 groups. Magnification: 400 ×. L H score of PRMT1, cleaved caspase-3, p-TBK1, and p-IRF3, and positive cells per area of CD86+ and CD206+ cells in the upper 4 groups. *P < 0.05, **P < 0.01, ***P < 0.001, ****P < 0.0001.
Fig. 7
Fig. 7. Schematic illustration of tumor-derived PRMT1 suppresses macrophage antitumor activity by inhibiting cGAS/STING signaling in gastric cancer cells.
PRMT1 knockdown inhibited the cGAS/STING pathway in GC, which produced type I IFNs to promote the polarization of M1-like macrophages in the tumor microenvironment (Created with BioRender.com).

References

    1. Siegel RL, Miller KD, Fuchs HE, Jemal A. Cancer statistics, 2021. CA: Cancer J Clin. 2021;71:7–33. - PubMed
    1. Smyth EC, Nilsson M, Grabsch HI, van Grieken NC, Lordick F. Gastric cancer. Lancet (Lond, Engl). 2020;396:635–48. - PubMed
    1. Thrift AP, El-Serag HB. Burden of Gastric Cancer. Clinical Gastroenterol Hepatol Off Clin Pract J Am Gastroenterol Assoc. 2020;18:534–42. - PMC - PubMed
    1. Zhang M, Hu S, Min M, Ni Y, Lu Z, Sun X, et al. Dissecting transcriptional heterogeneity in primary gastric adenocarcinoma by single cell RNA sequencing. Gut. 2021;70:464–75. - PMC - PubMed
    1. Chin EN, Yu C, Vartabedian VF, Jia Y, Kumar M, Gamo AM, et al. Antitumor activity of a systemic STING-activating non-nucleotide cGAMP mimetic. Science (N. Y, NY). 2020;369:993–9. - PubMed

MeSH terms