. 2025 Aug 26;16(1):7942.
doi: 10.1038/s41467-025-63119-5.

An integrated transcriptomic and proteomic map of the mouse hippocampus at synaptic resolution

Affiliations

An integrated transcriptomic and proteomic map of the mouse hippocampus at synaptic resolution

Eva Kaulich et al. Nat Commun. .

Abstract

Understanding the brain's molecular diversity requires spatially resolved maps of transcripts and proteins across regions and compartments. Here, we performed deep spatial molecular profiling of the mouse hippocampus, combining microdissection of 3 subregions and 4 strata with fluorescence-activated synaptosome sorting, transcriptomics, and proteomics. This approach revealed thousands of locally enriched molecules spanning diverse receptor, channel, metabolic, and adhesion families. Integration of transcriptome and proteome data highlighted proteins tightly linked to or decoupled from mRNA availability, in part due to protein half-life differences. Incorporation of translatome data identified roles for protein trafficking versus local translation in establishing compartmental organization of pyramidal neurons, with distal dendrites showing increased reliance on local protein synthesis. Classification of CA1 synapses revealed contributions from kinases, cytoskeletal elements, and adhesion molecules in defining synaptic specificity. Together, this study provides a molecular atlas of the hippocampus and its synapses (syndive.org), and offers insights into spatial transcript-protein relationships.


Conflict of interest statement

Competing interests: The authors declare no competing interests.

Figures
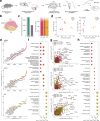
Fig. 1
Fig. 1. A pipeline for deep spatial transcriptomic and proteomic profiling of the mouse hippocampus, and comparative analysis of subregion transcriptomes and proteomes.
a Experimental workflow for tissue analysis. Horizontal brain slices were generated after cutting hemispheres at a 30° angle and subregions or CA1 strata were microdissected and homogenized, followed by parallel RNA-seq and data independent acquisition (DIA) mass spectrometry (see methods). Tissue pooled from 2 mice represented 1 independent biological replicate. SO, Stratum oriens; SP, Stratum pyramidale; SR, Stratum radiatum; SLM, Stratum lacunosum-moleculare. b Schematic indicating subregions CA1, CA2/3 and DG that were microdissected for tissue preparation. c Left: total number of detected mRNA transcripts and quantified protein groups across all subregions (n = 7 replicates). Right: valid value bar plots of quantified protein groups per subregion. Opaque bars indicate proteins quantified in 7/7 replicates. d Principal Component Analysis (PCA) of transcriptome (left) and proteome (right) shows clustering by subregion. Each data point represents one replicate. e Rank abundance plots of mRNA indicating the relative abundance of transcripts in a given subregion. Transcripts with the highest log2 fold change are ranked as 1. Coloured points represent transcripts significantly enriched in one subregion compared to the others (s value < 0.01, n = 7; see methods for details on normalization and differential expression), while all other detected transcripts are shown in gray. Top 10 transcripts by log2 fold change in each comparison as well as known markers are labelled. f Gene ontology (GO) overrepresentation analysis based on significantly enriched transcripts from each subregion when compared to both others. Top terms were determined by a one-sided hypergeometric test (p adjusted <0.05). Bubble size corresponds to the number of genes annotated to a given term. g Scatter plots showing log2 fold enrichment of proteins in each subregion compared to both others. Points are colored by significance (p adjusted <0.01, n = 7; see methods for details on normalization and differential expression) in each comparison. Non-significant proteins detected with 2 or more peptides are shown in grey. h GO overrepresentation analysis based on proteins significantly enriched in each subregion when compared to both others. Top terms and bubble size were determined as in (f). Source data are provided as a source data file.
Fig. 2
Fig. 2. Strata-specific organization of transcripts and proteins in CA1 give rise to specialized identities.
a Schematic indicating CA1 strata SO, SP, SR and SLM that were microdissected. b Left: total detected mRNA transcripts and quantified protein groups across all strata (n = 7 replicates). Right: valid value bar plots of quantified protein groups per stratum. Opaque bars indicate proteins quantified in 7/7 replicates. c PCA of transcriptomes (left) and proteomes (right) illustrating strata-specific clustering. Each data point represents one replicate. d Rank abundance plots of mRNA indicating the relative abundance of transcripts in given strata compared to whole CA1. Transcripts with the highest log2 fold-change are ranked as 1. Coloured points represent transcripts showing significant enrichment (s value < 0.01, n = 7; see methods for details on normalization and differential expression), while all other detected transcripts are shown in gray. Transcripts with the top 20 highest relative enrichment (ordered by log2 fold-change) are labeled. e Gene ontology (GO) overrepresentation analysis based on significantly enriched transcripts in each stratum. Top terms were determined by a one-sided hypergeometric test (p adjusted <0.05). Bubble size corresponds to the number of genes annotated to a given term. f Scatter plots showing log2 fold enrichment of proteins in a given stratum compared to their mean log2 intensity across all strata. Significantly enriched proteins (p adjusted <0.01, n = 7; see methods for details on normalization and differential expression) are shown in colour while all other enriched proteins detected with 2 or more peptides are in grey. g GO overrepresentation analysis showing top terms for proteins significantly enriched in each stratum. Top terms and bubble size were determined as in (e). Source data are provided as a source data file.
Fig. 3
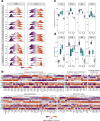
Fig. 3. Spatial organization of functional groups and disease-causing genes.
a Ridge plots of differential gene expression across CA1 strata for selected gene sets. Each plot represents the distribution of z-scored log2 fold changes for all transcripts (left) or proteins (right) annotated to specific biological processes or cellular components (see methods, source data and Supplementary Data 1-2 for detailed annotations). b Candidate heatmaps for z-scored log2 fold changes of transcripts and proteins associated with processes or cellular components shown in (a). Genes are ordered based on clustering of protein data. White boxes indicate missing values. Asterisks indicate significance in either mRNA or protein dataset as derived from differential expression analysis (s value < 0.01 or p adjusted <0.01, respectively, n = 7; see methods for details on normalization and differential expression). c, d Boxplots of abundances of mRNAs and proteins that have causative roles in disease and showed strata-specific enrichment. ± indicates significant enrichment or depletion in differential expression analysis (s value < 0.01 or p adjusted <0.01, respectively, n = 7; see methods for details on normalization and differential expression). Boxes indicate median (middle line) and interquartile ranges (IQR), with whiskers at 1.5 × IQR. Points represent values for each biological replicate (n = 7). Source data are provided as a source data file.
Fig. 4
Fig. 4. Correlation analysis of mRNAs and proteins across pyramidal neuron compartments.
a Pearson’s correlation of mean abundances of mRNAs (log2 DESeq2 normalized counts) and their respective protein (log2 intensity-based absolute quantification, iBAQ) across CA1 strata and within each stratum. b Selected examples showing strong positive (≥0.9) and negative (≤ –0.9) Pearson’s correlation in their mean abundance changes across strata. Abundances for individual replicates are shown as translucent lines, while solid lines represent mean values with error bars indicating ± SD (n = 7). c Selected GO terms overrepresented by all transcripts and proteins showing a strong positive or negative correlation in their mean abundance changes across strata. Significance was determined by a one-sided hypergeometric test and -log10 FDR values are indicated on the y-axis. d Protein half-lives of strongly positively and negatively correlated mRNA-protein pairs. A total of 2946 genes were mapped to neuronal protein half-life data from Dörrbaum et al.. Boxes indicate median (middle line) and interquartile ranges (IQR), with whiskers at 1.5 × IQR. Black translucent dots indicate outlier data points that fall beyond y-axis limits. Significance is indicated by asterisks (**p < 0.01, ****p < 0.0001) and was determined by Kruskal–Wallis test (χ²(2) = 57.8, p = 2.84 × 1013, df = 2, N = 3692) followed by a post hoc Dunn’s test with Bonferroni correction: all vs. positive (Z = −3.12, p = 0.00181, p adjusted = 0.00542), all vs. negative (Z = 6.54, p = 6.24 × 1011, p adjusted = 1.87 × 1010), and positive vs. negative (Z = 7.33, p = 2.29 × 1013, p adjusted = 6.87 × 1013). Source data are provided as a source data file.
Fig. 5
Fig. 5. Comparing mRNA localization and protein distribution across CA1 strata.
a Alluvial plot showing the site of enrichment of mRNAs and their corresponding proteins for different combinations of SO, SP, SR, and SLM. Width of flows represents the number of overlapping genes. b Tile plot showing candidate genes based on their mRNA-protein enrichment (also see Supplementary Data 3). Gene number represents the number of overlapping enriched mRNAs and proteins for a given combination. Tile size is proportional to overlap count. c Proportions of mRNAs with preferential translation in somata or neuropil based on the enrichment site of protein they encode. Genes were mapped to translatome data from Glock, Biever, et al.. Translation localization was determined on the basis of genes showing significant enrichment in somatic versus neuropil compartments in the translatome dataset. Source data are provided as a source data file.
Fig. 6
Fig. 6. Subregion-specific neuronal populations shape synaptic diversity in the hippocampus.
a Synaptosome isolation workflow: A Syn-1 Cre-driver line was crossed with a floxed Synaptophysin-tdTomato (SypTOM) reporter to label presynaptic terminals. Horizontal brain slicing and dissection was performed as in Fig. 1a. Crude synaptosomes were isolated using a Percoll-sucrose gradient and sorted using fluorescence-activated synaptosome sorting (FASS), followed by parallel RNA-seq and DIA mass spectrometry. Tissue pooled from 2 mice represented 1 independent biological replicate. b Schematic of synaptosomes from microdissected subregions. c Left: Detected transcripts and quantified protein groups in purified synaptosomes following contaminant filtering for each subregion (n = 5). Right: valid value bar plots of quantified protein groups per subregion. Opaque bars indicate proteins quantified in 5/5 replicates. d PLS-DA plot showing segregation by subregion for both transcriptome and proteome. Each data point represents one replicate. e Scatter plots of log2 fold changes for transcripts (top) and proteins (bottom) showing positive enrichment in synaptosomes in each subregion versus the other groups. Points are colored by significance in each comparison (s value < 0.05 or p adjusted <0.05, respectively, n = 5; see methods for details on normalization and differential expression). Non significant points are shown in grey. Top candidates are labelled with their gene name. Source data are provided as a source data file.
Fig. 7
Fig. 7. Classification of compartment-specific synaptic mRNA and protein signatures along pyramidal neurons.
a Schematic of synaptosomes from microdissected strata. b Left: Detected transcripts and quantified protein groups in purified synaptosomes following contaminant filtering for each stratum (n = 5). Right: valid value bar plots of quantified protein groups per stratum. Opaque bars indicate proteins quantified in 5/5 replicates. c PLS-DA plot showing segregation of strata for both transcriptome and proteome. Each data point represents one replicate. d Variable Importance in Projection (VIP) plots showing VIP scores for the top five loadings from the first three components in PLS-DA. VIP scores indicate the contribution of each variable to the discrimination between strata in the PLS-DA model. Scores are scaled from 0 to 100. Higher VIP scores represent greater importance in distinguishing between strata. e Candidate heatmaps displaying the expression patterns of mRNA and proteins across synapses along the CA1 neuron. White boxes indicate missing values. Asterisks indicate significance in either mRNA or protein dataset as derived from differential expression analysis (s value < 0.05 or p adjusted <0.05, respectively, n = 5; see methods for details on normalization and differential expression). Source data are provided as a source data file.

References

    1. Lein, E. S. et al. Genome-wide atlas of gene expression in the adult mouse brain. Nature445, 168–176 (2007). - PubMed
    1. Biesemann, C. et al. Proteomic screening of glutamatergic mouse brain synaptosomes isolated by fluorescence activated sorting. EMBO J.33, 157–170 (2014). - PMC - PubMed
    1. Sharma, K. et al. Cell type- and brain region-resolved mouse brain proteome. Nat. Neurosci.18, 1819–1831 (2015). - PMC - PubMed
    1. Tasic, B. et al. Shared and distinct transcriptomic cell types across neocortical areas. Nature563, 72–78 (2018). - PMC - PubMed
    1. van Oostrum, M. et al. The proteomic landscape of synaptic diversity across brain regions and cell types. Cell186, 5411–5427.e23 (2023). - PMC - PubMed

LinkOut - more resources