. 2025 Aug 26;16(1):7961.
doi: 10.1038/s41467-025-62731-9.

Crotonylation of IDH1 alleviates MASLD progression by enhancing the TCA cycle

Affiliations

Crotonylation of IDH1 alleviates MASLD progression by enhancing the TCA cycle

Shanshan Liu et al. Nat Commun. .

Abstract

Metabolic dysfunction-associated steatotic liver disease (MASLD), potentially ameliorated by bariatric-metabolic surgery, remains a global health concern in the absence of approved drugs. Protein post-translational modifications (PTMs) are crucial for MASLD. However, the functional significance of lysine crotonylation (Kcr) remains unclear. We aimed to investigate the mechanisms by Kcr-regulated IDH1 in the tricarboxylic acid (TCA) cycle and MASLD development. Herein, we reported a quantitative proteomics analysis of global crotonylome upon MASLD and Post-bariatric. Specifically, decreases in K58cr, K151cr, K212cr and K345cr of IDH1 upon MASLD were observed. PCAF and SIRT7 dynamically regulated the IDH1 Kcr. Abolishment of IDH1 Kcr impaired TCA cycle by decreasing IDH1 enzymatic activity. Male mice with liver-specific expression of crotonylation-mimic mutants of IDH1 were resistant to HFD-induced obesity, insulin resistance, glucose intolerance and MASLD. Our findings unravel the mechanisms of IDH1 Kcr and indicate that targeting PCAF/SIRT7-IDH1 Kcr and metabolites may be a promising strategy for MASLD therapy.


Conflict of interest statement

Competing interests: The authors declare no competing interests.

Figures
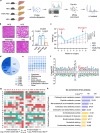
Fig. 1
Fig. 1. Global landscape of crotonylome in HFD-induced MASLD and post-bariatric surgery.
a Schematic representation of experimental workflow showing 4D label-free quantification of Kcr in NCD, HFD, PAIR-FED and VSG mouse livers. Created in BioRender. Liu, S. (2025) https://BioRender.com/vr8ptir. b Representative H&E staining of liver sections 8 weeks post-operation in NCD, HFD, PAIR-FED, and VSG group mice (n = 5/group). NAS scores were derived from H&E staining. Scale bars: 100 μm. c Body weight was recorded weekly post-operation in NCD, HFD, PAIR-FED, and VSG group mice (n = 5/group). d Pie chart illustrating the distribution of the number of identified Kcr sites per protein. e Map illustrating the subcellular distribution of Kcr proteins. f Icelogo representation illustrating flanking sequence preferences for all Kcr sites. g Motif analysis of all identified Kcr proteins. h Bar graphs illustrating representative ontology annotations enriched in the Kcr proteome. Data are shown as the mean ± SD. P values were obtained using one-way ANOVA followed by Tukey’s multiple comparisons test. Source data are provided as a Source Data file.
Fig. 2
Fig. 2. Quantitative analysis of Kcr proteome in MASLD reveals distinct disease-specific and remodeling signatures after bariatric surgery.
a Histogram showing the ratio distribution of quantifiable Kcr proteins and sites between HFD and NCD mice livers. b Bar graphs showing GO pathway associated with all identified Kcr proteins between HFD and NCD mouse livers. c Bar graphs showing GO pathway associated with up-regulated (left) or down-regulated (right) Kcr proteins between HFD and NCD mice liver. d Histogram showing the ratio distribution of quantifiable Kcr proteins and sites between VSG and PAIR-FED mice liver. e Bar graphs showing GO pathway associated with all identified Kcr proteins between VSG and PAIR-FED mice liver. f Bar graphs showing GO pathway associated with up-regulated (left) or down-regulated (right) Kcr proteins between VSG and PAIR-FED mice livers. g Venn diagram showing the overlap between HFD-downregulated Kcr substrates and VSG-upregulated substrate Kcr substrates. h Overview of the TCA cycle based on crotonylome.
Fig. 3
Fig. 3. IDH1 Kcr at K58, K151, K212 and K345 sites decreases upon MASLD.
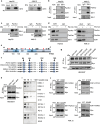
a Immunoprecipitation in HepG2 or AML12 cells with anti-PanKcr or anti-IgG followed by immunoblotting with anti-IDH1. b Immunoprecipitations in HepG2 or AML12 cells with anti-IDH1 or anti-IgG followed by immunoblotting with anti-PanKcr. c Immunoprecipitations in HepG2 or AML12 cells treated with or without PA + OA for 24 h using anti-PanKcr or anti-IgG followed by immunoblotting with anti-IDH1. d Immunoprecipitations in HepG2 or AML12 cells treated with or without PA + OA using anti-IDH1 followed by immunoblotting with anti-PanKcr or anti-IgG. e Schematic diagram of IDH1. f Sequence alignment homology around the four crotonylation sites in different species IDH1. g K58, K151, K212 and K345 are key Kcr sites of IDH1 in vivo. Immunoprecipitation assays in HEK293T cells upon overexpression of the indicated Myc-tagged constructs with anti-Myc followed by immunoblotting with anti-Myc and anti-PanKcr. h Immunoprecipitation assays in HEK293T cells upon overexpressing Myc-tagged IDH1 WT or 4KR with anti-Myc followed by immunoblotting with anti-Myc and anti-PanKcr. i The specificity of antibodies against IDH1-K58cr, IDH1-K151cr, IDH1-K212cr and IDH1-K345cr was verified by dot blot assays. The nitrocellulose membrane was spotted with the indicated amounts of uncrotonylated or crotonylated IDH1 peptides and immunoblotted with the indicated antibodies. j Verification of the specificity of anti-IDH1-K58cr, anti-IDH1-K151cr, anti-IDH1-K212cr and anti-IDH1-K345cr by western blotting. Immunoprecipitation assays were performed in AML12 cells overexpressing the indicated Myc-tagged IDH1 constructs with anti-Myc followed by immunoblotting with the indicated antibodies, respectively. Source data are provided as a Source Data file.
Fig. 4
Fig. 4. IDH1 Kcr is mediated by PCAF and SIRT7.
a Immunoprecipitation assays with anti-Myc in HEK293T cells co-transfected with Myc-tagged IDH1 and HA-tagged HATs followed by immunoblotting with antibodies against the indicated proteins. b Immunoprecipitation assays with anti-IDH1 in HEK293T cells transfected with control siRNA or siRNA targeting PCAF followed by immunoblotting with anti-PanKcr or anti-IgG. c HEK293T cells were expressed Myc-tagged IDH1 and then treated with 3 μM TSA or 5 mM NAM for 12 h, immunoprecipitation assays with anti-Myc followed by immunoblotting with antibodies against the indicated proteins. d Immunoprecipitation assays with anti-Myc in HEK293T cells transfected with Myc-tagged IDH1 and FLAG-tagged SIRTs followed by immunoblotting with antibodies against the indicated proteins. e Immunoprecipitation assays with anti-IDH1 in HEK293T cells transfected with control siRNA or siRNA targeting SIRT7 followed by immunoblotting with anti-PanKcr or anti-IgG. f Immunoprecipitation assays with anti-Myc in HEK293T cells co-transfected with Myc-tagged IDH1, HA-tagged PCAF and FLAG-tagged SIRT7, followed by immunoblotting with the indicated antibodies. g Schematic diagram of dynamic regulation of IDH1 Kcr by PCAF and SIRT7. Source data are provided as a Source Data file.
Fig. 5
Fig. 5. IDH1 Kcr enhances enzymatic activity and is essential for TCA cycle function.
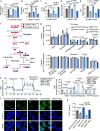
a AML12 cells were treated with specific siRNA targeting IDH1 3’ UTR or control siRNA for 24 h before transfection with the indicated Myc-tagged constructs. IDH1 activity assay with purified indicated Myc-tagged immunoprecipitates from AML 12 cells (n = 3/group). b, c Histogram displaying Isocitrate (b) and α-KG (c) levels in AML12 cells (n = 3/group) described in (a). d, e Histogram displaying NADP+/NADPH ratio (d) and ATP levels (e) in AML12 cells (n = 3/group) described in (a). f Schematic diagram of 13C-labeled D-13C6 glucose in glycolysis and the TCA cycle. g Histogram showing changes in TCA cycle (upper) or glycolysis (lower)-related metabolites among IDH1-WT and IDH1 mutants (n = 3/group). h The Oxygen consumption rate (OCR) in AML12 cells (n = 6/group) with endogenous IDH1 knockdown and reconstituted expression of IDH1 WT, IDH1 4KR or 4KQ. i Quantification of Basal respiration, maximal respiration, and ATP production (n = 6/group). j Representative fluorescence images reflecting ROS level in AML12 cells described in (a), scale bar: 50 μm. k Fatty acid beta oxidation (FAO) efficiency in AML12 cells (n = 3/group) described in (a). Data are shown as the mean ± SD. P values were obtained using one-way ANOVA followed by Tukey’s multiple comparisons test (ae, h, i, k) or Sidak test (g). Source data are provided as a Source Data file.
Fig. 6
Fig. 6. IDH1 crotonylation attenuates lipid deposition in AML12 cells.
a AML12 cells were treated with control or IDH1 siRNA for 24 h, followed by expression of Myc-tagged Vector, IDH1-WT, IDH1-K58R, IDH1-K151R, IDH1-K212R, IDH1-K345R, IDH1-4KR and IDH1-4KQ. After another 24 h, cells were treated with BSA (top) or 0.5 mM PA + OA (bottom) for 24 h, then fixed and stained with Oil Red O. Scale bars: 100 μm. b Quantification of the Oil Red O staining area as described in (a) (n = 6/group). c The expression of the indicated proteins was measured in AML12 cells as described in (a). d AML12 cells were treated with control or PCAF siRNA for 48 h before cells were treated with BSA (top) or 0.5 mM PA + OA (bottom) for another 24 h, then fixed and stained with Oil Red O. Scale bars: 100 μm; e Quantification of the Oil Red O staining area as described in (d) (n = 3/group). f The expression of the indicated proteins was measured in AML12 cells as described in (d). g FLAG-tagged SIRT7 were expressed in AML12 cells for 48 h, followed by treatment with BSA (top) or 0.5 mM PA + OA (bottom) for 24 h, fixed and stained with Oil Red O. Scale bars: 100 μm. h Quantification of the Oil Red O staining area as in (g) (n = 3/group). i The expression of the indicated proteins was measured in AML12 cells as described in (g). Data are shown as the mean ± SD. P values were obtained using one-way ANOVA followed by Tukey’s multiple comparisons test (b) or two-tailed unpaired Student’s t-test (e, h). All experimental data were verified at least three independent experiments. Source data are provided as a Source Data file.
Fig. 7
Fig. 7. IDH1-4KR exacerbates lipid accumulation and disrupts TCA cycle function in HFD-fed mice.
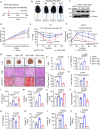
a Schematic of the HFD-induced MASLD model. b Photos of AAV8-TBG-ZsGreen, AAV8-TBG-IDH1-WT, AAV8-TBG-IDH1-4KR, and AAV8-TBG-IDH1-4KQ mice. c Representative western blotting analysis of liver FLAG-IDH1 and α-Tubulin expression levels in the mice described in (a). d Body weight was measured weekly in AAV8-ZsGreen, AAV8-IDH1-WT, AAV8-IDH1-4KR, or AAV8-IDH1-4KQ mice (n = 8/group). e Blood glucose concentration was determined using the insulin tolerance test (ITT) in 22-week-old mice (n = 8/group). IP: IDH1-WT vs. IDH1-4KR; IIP: IDH1-WT vs. IDH1-4KQ. f Blood glucose concentration was determined using the intraperitoneal glucose tolerance test (IPGTT) in 22-week-old mice (n = 8/group). IP: IDH1-WT vs. IDH1-4KR; IIP: IDH1-WT vs. IDH1-4KQ. g Representative images of liver morphology (top) and liver sections stained with H&E (middle), or Oil Red O (bottom) are shown. Scale bars: 100 μm. h, i NAS score (h) and quantification of the Oil Red O staining of liver sections (i) from each group (n = 8/group). The stained area of each liver was normalized to the control group average. j, k Liver weight (j) and liver index (k) of the mice (n = 8/group) described in (a) were measured. l IDH1 activity assay in the livers of the mice (n = 8/group) described in (a). m, n Histogram showing Isocitrate (m) and α-KG (n) levels in the livers of mice (n = 8/group) indicated in (a). o Histogram displaying NADP+/NADPH ratio in the livers of mice (n = 8/group) indicated in (a). p FAO efficiency in the livers of the mice (n = 8/group) described in (a). qs Histogram showing hepatic total cholesterol (TC) (q), triglyceride (TG) (r) and Free fatty acids (FFA) (s) concentrations in the livers of mice (n = 8/group) indicated in (a). Data are shown as the mean ± SD. P values were obtained using one-way ANOVA followed by Tukey’s multiple comparisons test. Source data are provided as a Source Data file.
Fig. 8
Fig. 8. In HFD-induced MASLD mice models, PCAF/SIRT7-mediated IDH1 Kcr axis is downregulated, whereas VSG reverses these effects.
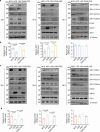
a Protein lysates from the livers of NCD, HFD, VSG, and PAIR-FED mice (n = 5/group) from first cohort were extracted for western blotting using IDH1-K58cr, IDH1-K151cr, IDH1-K212cr, IDH-K345cr, PCAF, SIRT7, IDH1 and α-Tubulin antibodies. b Relative mRNA levels of Pcaf (left), Sirt7 (middle), and Idh1(right) in NCD, HFD, VSG and PAIR-FED mice from first cohort. c Protein lysates from the livers of NCD, HFD, VSG, and PAIR-FED mice (n = 5/group) from second cohort were extracted for western blotting using IDH1-K58cr, IDH1-K151cr, IDH1-K212cr, IDH-K345cr, PCAF, SIRT7, IDH1 and α-Tubulin antibodies. d Relative mRNA levels of Pcaf (left), Sirt7 (middle), Idh1 (right) in NCD, HFD, VSG and PAIR-FED mice from second cohort. Data are shown as the mean ± SD. P values were obtained using one-way ANOVA followed by Tukey’s multiple comparisons test. All experimental data were verified at least three independent experiments. Source data are provided as a Source Data file.
Fig. 9
Fig. 9. In MASH mice models, PCAF/SIRT7-mediated IDH1 Kcr axis is significantly decreased.
a Schematic overview of the GAN-MASH models. Created in BioRender. Liu, S. (2025) https://BioRender.com/vr8ptir. b Photos of NCD and GAN group mice at 34 weeks. c Protein lysates from the livers of NCD and GAN mice were extracted for western blotting using IDH1-K58cr, IDH1-K151cr, IDH1-K212cr, IDH-K345cr, IDH1, PCAF, SIRT7, α-SMA and α-Tubulin antibodies. d Body weight of NCD and GAN group mice (n = 10/group) at 34 weeks. e Relative mRNA levels of Pcaf, Sirt7, and Idh1 in NCD and GAN mice. f Representative images of liver tissues from NCD and GAN group mice (n = 10/group) were presented, including H&E-stained sections, Oil Red O staining, Masson’s trichrome staining, Sirius red staining, NAS scores, and relative Oil Red O area. Scale bars: 100 μm. g Schematic overview of the MCD-MASH models. Created in BioRender. Liu, S. (2025) https://BioRender.com/vr8ptir. h Photos of NCD and MCD group mice at 14 weeks. i Protein lysates from the livers of NCD and MCD mice were extracted for western blotting using IDH1-K58cr, IDH1-K151cr, IDH1-K212cr, IDH-K345cr, IDH1, PCAF, SIRT7 α-SMA and α-Tubulin antibodies. j Body weight of NCD and MCD group mice (n = 10/group) at 14 weeks. k Relative mRNA levels of Pcaf, Sirt7, and Idh1 in NCD and MCD mice. l Representative images of liver tissues from NCD and MCD group mice were presented, including H&E-stained sections, Oil Red O staining, Masson’s trichrome staining, Sirius red staining, NAS scores, and relative Oil Red O area. Scale bars: 100 μm. Data are shown as the mean ± SD. P values were obtained using two-tailed unpaired Student’s t-test. Data were verified in three (c, e, i, k) independent experiments. Source data are provided as a Source Data file.
Fig. 10
Fig. 10. The PCAF/SIRT7-mediatded IDH1 Kcr exhibits progressive suppression in parallel with advancement of MASLD.
a Representative images of liver tissues from healthy controls, MASLD and MASH patients were presented, including H&E-stained sections, Oil Red O staining, Masson’s trichrome staining and Sirius red staining. Scale bars: 100 μm. b Protein lysates from the liver tissues from healthy, MASLD and MASH patients were extracted for western blotting using IDH1-K58cr, IDH1-K151cr, IDH1-K212cr, IDH-K345cr, IDH1, PCAF, SIRT7, α-SMA and α-Tubulin antibodies. c Relative mRNA expression levels of PCAF and SIRT7 in liver tissues from healthy and MASLD patients (n = 16/group). d Hepatic PCAF and SIRT7 levels were associated to MASLD progression in two independent cohorts (GSE135251, GSE130970). e Schematic outline illustrates the mechanisms that the PCAF/SIRT7-mediatded IDH1 Kcr alleviates MASLD progression by enhancing the TCA cycle. Created in BioRender. Liu, S. (2025) https://BioRender.com/rxqskmj. Data are shown as the mean ± SD. P values were obtained using two-tailed unpaired Student’s t-test. All data were verified in three independent experiments. Source data are provided as a Source Data file.

References

    1. Powell, E. E., Wong, V. W.-S. & Rinella, M. Non-alcoholic fatty liver disease. Lancet397, 2212–2224 (2021). - PubMed
    1. Loomba, R., Friedman, S. L. & Shulman, G. I. Mechanisms and disease consequences of nonalcoholic fatty liver disease. Cell184, 2537–2564 (2021). - PMC - PubMed
    1. Rinella, M. E. et al. A multisociety Delphi consensus statement on new fatty liver disease nomenclature. J. Hepatol.79, 1542–1556 (2023). - PubMed
    1. Quek, J. et al. Global prevalence of non-alcoholic fatty liver disease and non-alcoholic steatohepatitis in the overweight and obese population: a systematic review and meta-analysis. Lancet Gastroenterol. Hepatol.8, 20–30 (2023). - PubMed
    1. Gallego-Duran, R. Romero-Gomez M. Epigenetic mechanisms in non-alcoholic fatty liver disease: An emerging field. World J. Hepatol.7, 2497–2502 (2015). - PMC - PubMed

MeSH terms

LinkOut - more resources