. 2025 Aug 26;16(1):7955.
doi: 10.1038/s41467-025-63271-y.

Multi-omics analysis identifies an M-MDSC-like immunosuppressive phenotype in lineage-switched AML with KMT2A rearrangement

Affiliations

Multi-omics analysis identifies an M-MDSC-like immunosuppressive phenotype in lineage-switched AML with KMT2A rearrangement

Takashi Mikami et al. Nat Commun. .

Abstract

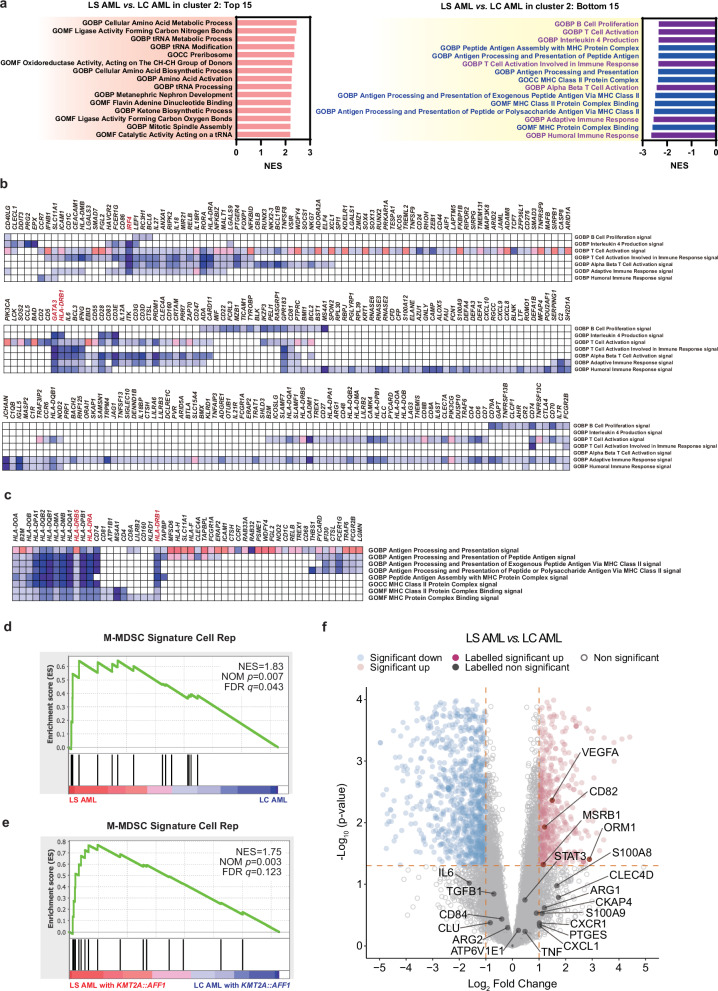
Lineage switching (LS) is the conversion of cancer cell lineage during the course of a disease. LS in leukemia cell lineage facilitates cancer cells escaping targeting strategy like CD19 targeted immunotherapy. However, the genetic and biological mechanisms underlying immune evasion by LS leukemia cells are not well understood. Here, we conduct a multi-omics analysis of patient samples and find that lineage-switched acute myeloid leukemia (LS AML) cells with KMT2A rearrangement (KMT2A-r) possess monocytic myeloid derived suppressor cell (M-MDSC)-like characteristics. Single-cell mass cytometry analysis reveals an increase in the M-MDSC like LS AML as compared to those of lineage-consistent KMT2A-r AML, and single-cell transcriptomics identify distinct expression patterns of immunoregulatory genes within this population. Furthermore, in vitro assays confirm the immunosuppressive capacity of LS AML cells against T cells, which is analogous to that of MDSCs. These data provide insight into the immunological aspects of the complex pathogenesis of LS AML, as well as development of future treatments.


Conflict of interest statement

Competing interests: The authors declare no competing interests.

Figures

Fig. 1
Fig. 1. Transcriptomic characterization of lineage-switched AML with the KMT2A rearrangement.
a Morphologic switching of LS from B-cell precursor ALL to monocytic AML (FAB: M5). Representative samples from patient LS AML2 are shown. May-Giemsa stain, ×400. b Schematic diagram showing sample collection and RNA-seq analysis of the inhouse cohort and deposited data. Most relapsed cases had samples taken at both disease presentation and relapse. c, d PCA distribution plots for each sample (Probe: 1500). The status (c) and fusion partner (d) of each sample are indicated. Pres: at disease presentation, Rel: at relapse. Source data are provided as a Source Data file. e Hierarchical clustering using Ward’s distance (Pearson), based on the 1500 most differentially expressed genes across nine LS AML samples and 54 LC AML samples. The optimal cluster number was accessed by plots in ConsensusClusterPlus (Supplementary Fig. 2c–f).
Fig. 2
Fig. 2. Gene set enrichment analysis and analysis of differentially expressed genes in lineage-switched AML.
a Ontology gene sets ranked in the top 15 and bottom 15 normalized enrichment scores (NESs) calculated by gene set enrichment analysis (GSEA). LS AML and LC AML in Cluster 2 were compared. Adaptive immune-related gene sets are shown in purple; antigen presentation-related gene sets are shown in blue. GOCC gene ontology cellular component, GOBP gene ontology biological process, GOMF gene ontology molecular function, HP human phenotype. Source data are provided as a Source Data file. b, c Leading edge analysis of adaptive immune-related gene sets (b) and antigen presentation-related gene sets (c) ranked in the bottom 15 when comparing LS AML and LC AML in Cluster 2. Expression values are represented by colors, where the range of colors (red, pink, light blue, dark blue) reflects the range of expression values (high, moderate, low, lowest, respectively). d Enrichment analysis of M-MDSC signatures comparing LS AML and LC AML. The “M-MDSC Signature Cell Rep” comprises ORM1, S100P, SLCO4C1, CYP1B1, CLEC4D, CHD7, CKAP4, MSRB1, CLU, CD82, CPEB4, TLK1, OSBPL8, ABHD2, ATP6V1E1, and ROCK1. NOM: nominal; FDR: false discovery rate. Nominal (NOM) p-value represents the credibility of the enrichment result, and false discovery rate (FDR) q-value is the p-value adjusted after multiple hypothesis testing (Benjamini-Hochberg method, two-sided). e Enrichment analysis (pre-ranked) of M-MDSC signatures comparing LS AML with KMT2A::AFF1 and LC AML with KMT2A::AFF1. NOM p-value represents the credibility of the enrichment result, and FDR q-value is the p-value adjusted after multiple hypothesis testing (Benjamini-Hochberg method, two-sided). f Volcano plot showing differentially expressed genes (DEGs) between LS AML and LC AML. The significance-adjusted p-value (calculated by DESeq2 using multiple comparisons; Benjamini-Hochberg method, two-sided) is set as <0.05, and a significant-fold change is defined as > |2| (orange dotted lines). The names of the M-MDSC-related genes are displayed as dark red or gray dots.
Fig. 3
Fig. 3. Detection of M-MDSC-like AML cells and Tregs in AML samples by mass cytometry.
a, b Mass cytometry viSNE plots showing expression of 39 markers. Cells consistent with the definition of M-MDSCs (i.e., CD11b+CD14+CD15-HLA-DRlow/–) are red, AML cells are pink, monocytes are yellow-green, and other immune cells are light blue (a). The LS AML1 sample is shown as a representative plot, and expression of CD11b, CD14, CD15, and HLA-DR is displayed as a heatmap (b). c Percentage of M-MDSC-like AML cells within the AML cell population. LC AML cases (n = 5) and LS AML cases (n = 5) were compared (median with 95% confidence interval (CI); statistical analysis was performed using the Mann-Whitney test, two-sided, p = 0.0079). d Percentage of Tregs (CD4+CD25+CD127- T cells) within the CD4+ T cell population. LC AML cases (n = 5) and LS AML cases (n = 5) were compared (median with 95% CI; p = 0.0079, Mann-Whitney test, two-sided). e Percentage of effector Tregs (CD4+CD25+CD127-CD45RA-Foxp3high T cells) within the CD4+ T cell population. LC AML cases (n = 5) and LS AML cases (n = 5) were compared (median with 95% CI; p = 0.016, Mann-Whitney test, two-sided). Source data of Fig. 3c-e are provided as a Source Data file.
Fig. 4
Fig. 4. Single-cell RNA-seq analysis of lineage-switched AML compared with M-MDSCs in autoimmune diseases.
a UMAP plot of single-cell transcriptomic data obtained from five LS AML, five LC AML, and three autoimmune disease samples. SLE systemic lupus erythematosus, sJIA systemic juvenile idiopathic arthritis. b The normalized intensity of the gene signatures (monocyte, HLA-DR, and M-MDSC) on the UMAP is represented by color. c The M-MDSC-like AML subset and M-MDSCs (red) are defined as cells with a normalized expression level of M-MDSC signature genes ≥ 150 (upper figure). Within that subset, LS AML cells are shown in orange, LC AML cells in green, and autoimmune disease M-MDSCs in red (lower figure). d The M-MDSC-like LS AML subset and the non-M-MDSC-like LS AML subset were compared by hematopoietic gene set analysis. Enriched terms across input gene lists are ranked according to their adjusted p-value. A two-sided well-adopted hypergeometric test and Benjamini-Hochberg p-value correction were used for multiple comparisons. R-HSA reactome-Homo sapiens, GO gene ontology, WP WikiPathways. Source data are provided as a Source Data file. e Network of terms enriched in gene sets characteristic of the M-MDSC-like LS AML subset. In the left figure, these are colored according to cluster ID; nodes that share the same cluster ID are typically close to each other. In the right figure they are colored by p-value. A two-sided well-adopted hypergeometric test and Benjamini-Hochberg p-value correction were used for multiple comparisons. f k-nearest neighbor graphs created by the SPRING pipeline. The expression of each gene signature (M-MDSC, HSC/MPP, and neutrophil-myeloid progenitor) is shown by color.
Fig. 5
Fig. 5. Functional in vitro co-culture assays validating the MDSC-like characteristics of lineage-switched AML.
AML cells from patients LC AML1, 3, 4, and from patients LS AML1, 2, 4, were used for the in vitro co-culture assays. a Schematic diagram of the T cell suppression assay using AML cells and induced M-MDSCs. b Representative CFSE histograms and dot plots of IFN-γ intracellular staining obtained after 5 days of culture in the absence of LS AML1 cells, or in the presence of LS AML1 cells (at various ratios). The number of T cell divisions is indicated above each peak. c The T cell division index at different [AML cell or induced M-MDSC]/T cell ratios (mean ± standard deviation (SD); statistical analysis was performed using two-way ANOVA with Tukey’s multiple comparisons test). LC AML cells (from patients LC AML1, 3, 4: n = 3), LS AML cells (from patients LS AML1, 2, 4: n = 3), and induced M-MDSCs made from PBMC from different healthy individuals (n = 3) were compared. d Percentage of IFN-γ+ CD4+ T cells within the total CD4+ T cell population at different [AML cell or induced M-MDSC]/T cell ratios (mean ± SD; statistical analysis was performed using two-way ANOVA with Tukey’s multiple comparisons test). LC AML cells (from patients LC AML1, 3, 4: n = 3), LS AML cells (from patients LS AML1, 2, 4: n = 3), and induced M-MDSCs made from PBMC from different healthy individuals (n = 3) were compared. e Schematic diagram of the Treg co-culture assay. f The gating criterion used to identify effector Tregs within CD4+ T cells in control PBMCs. The CD25+CD127-CD45RA-Foxp3high population (Fraction II), located in the bottom right part of the plot, represents effector Tregs; the same gating scheme was adopted for all co-culture samples. Fr: fraction. g The percentage of effector Tregs within the CD4+ T cell population after 5 days of co-culture (mean ± SD; one-way ANOVA with Turkey’s multiple comparison test). LC AML cells (from patients LC AML1, 3, 4: n = 3), LS AML cells (from patients LS AML1, 2, 4: n = 3), and induced M-MDSCs made from PBMC from different healthy individuals (n = 3) were compared. All experiments above were repeated and yielded similar results. Source data of Figs. 5c-d, and 5g are provided as a Source Data file.

References

    1. Rossi, J. G. et al. Lineage switch in childhood acute leukemia: an unusual event with poor outcome. Am. J. Hematol.87, 890–897 (2012). - PubMed
    1. Wolfl, M. et al. Spontaneous reversion of a lineage switch following an initial blinatumomab-induced ALL-to-AML switch in MLL-rearranged infant ALL. Blood Adv.2, 1382–1385 (2018). - PMC - PubMed
    1. Kurzer, J. H. & Weinberg, O. K. To B- or not to B-: a review of lineage switched acute leukemia. Int. J. Lab Hematol.44, 64–70 (2022). - PubMed
    1. Jacoby, E. et al. CD19 CAR immune pressure induces B-precursor acute lymphoblastic leukaemia lineage switch exposing inherent leukaemic plasticity. Nat. Commun.7, 12320 (2016). - PMC - PubMed
    1. Silbert, S. K. et al. Project evolve, evaluation of lineage switch (LS), an International Initiative: preliminary results reveal dismal outcomes in patients with LS. Blood142, 4202–4202 (2023).

MeSH terms

Substances

LinkOut - more resources