. 2025 Aug 26;16(1):7945.
doi: 10.1038/s41467-025-63212-9.

Nascent liver proteome reveals enzymes and transcription regulators under physiological and alcohol exposure conditions

Affiliations

Nascent liver proteome reveals enzymes and transcription regulators under physiological and alcohol exposure conditions

Jiayu Gu et al. Nat Commun. .

Abstract

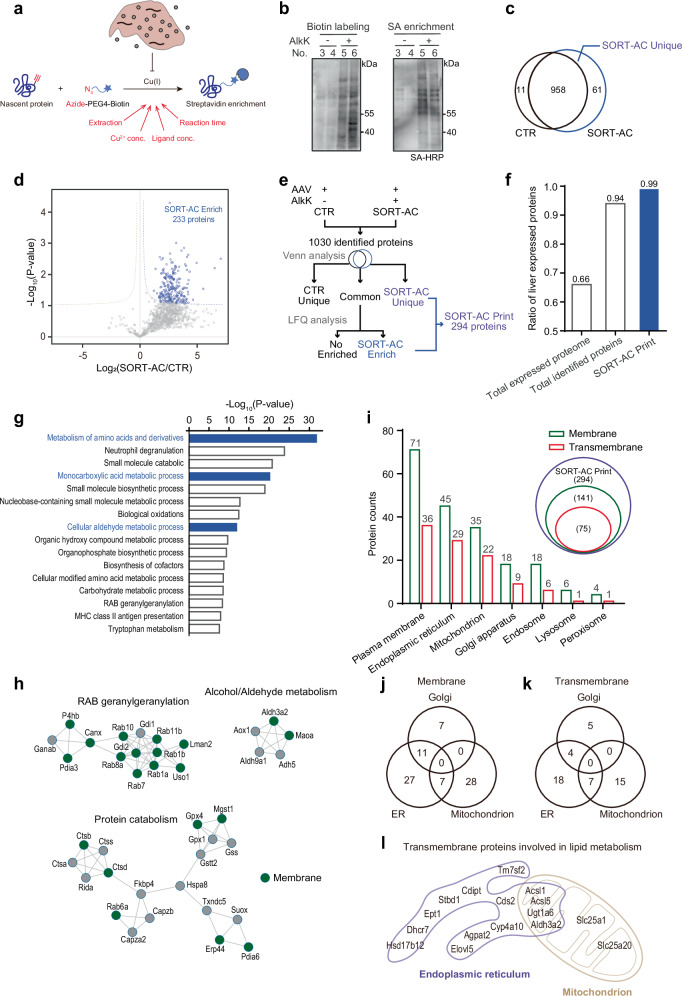
The liver proteome undergoes dynamic changes while performing hundreds of essential biological functions. Dysregulation of the liver proteome under alcoholic conditions leads to alcohol-associated liver disease (ALD), a major health challenge worldwide. There is an urgent need for quantitative and liver-specific proteome information in living animals to understand the pathophysiological dynamics of this largest solid organ. Here, we develop a comprehensive approach that specifically identifies the nascent proteome and preferentially enriches membrane proteins in living mouse hepatocytes and is broadly applicable to studies of the liver under various physiological and pathological conditions. In the ethanol-induced liver injury mouse model, the nascent proteome successfully identifies and validates a number of transcription regulators, enzymes, and protective chaperones involved in the molecular regulation of hepatic steatosis, in addition to almost all known regulatory proteins and pathways related to alcohol metabolism. We discover that Phb1/2 is an important transcription coregulator in the process of ethanol metabolism, and one identified fatty acid metabolism enzyme Acsl1/5, whose inhibition protects cells and mice from lipid accumulation, a key symptom of hepatic steatosis.


Conflict of interest statement

Competing interests: The authors declare no competing interests.

Figures

Fig. 1
Fig. 1. The strategy for labeling nascent proteins in prokaryotes and eukaryotes.
a Chemical structure of AlkK with reactive handle colored in red. b Cartoon of vectors used in the GFP reporter assay for amber suppression efficiency. GFP-190TAG reporter was co-transformed with PylRS variant into E. coli and full length of GFP is visualized in the presence or absence of AlkK with western blot analysis. c Western blot analysis of the amber suppression efficiency in E. coli with PylRS variants. Arrows indicate the full-length and truncated GFP. Experiment was independently repeated three times. d Schematic of vectors in the FACS reporter assay, in which the sequence from MmPylRS is gray, the sequence from MbPylRS is brown, the nuclear export signal sequence is yellow. The PylRS vectors was co-transfected with the mCherry-T2A-EGFP reporter into cells for the subsequent analysis. e FACS analysis of amber suppression efficiency in HEK293T cells transfected with the orthogonal systems with 1 mM AlkK. f Analysis of 20 natural amino acids distribution on total vertebrate proteins, and the ratio of amino acids distribution on surface and interface on proteins. The residues selected for AlkK incorporation are colored in red. g Distribution of 20 natural amino acids in human transmembrane proteins. The residues selected for AlkK incorporation are colored in red. h SORT labeling of AlkK across the whole proteome of mammalian cells with the indicated anti-codons. Right, the quantitative analysis of labeling signal intensities. Experiment was independently repeated three times. i Analysis of nascent proteomes labeled in cells transfected with PylT-K, -A, -S, or -M individually or in combination. j Nascent proteomes harvested at time points from 0 to 40 h after AlkK removal from HEK293T cells transfected with SORT system and cultured with AlkK for 48 h. Experiment was independently repeated three times. k Heatmap analysis of changes in the nascent proteome at 0, 24, and 40 h after AlkK release following SORT labeling. l, m Quantification of significantly downregulated total proteins and membrane proteins at different time points. The significance downregulated parameter of S0 = 0.1 and a false discovery rate <0.075. Source data are provided as a Source Data file.
Fig. 2
Fig. 2. The strategy for labeling nascent proteins in living mice.
a The strategy for labeling and identifying nascent proteome in SORTKASM mouse liver by SORT-AC. Each mouse received an injection of 100 μL AAV-TTR-Cre (1 × 1012 vg/mL). b The whole slide fluorescence scanning of liver sections. EGFP signal represented the AlkKRS expression level in liver tissue. Cy5 signal represented the labeled nascent proteome. Scale bar, 1 mm. Representative images of n = 3 experiments. c Schematic illustration of nascent proteome turnover in mice. SORTKASM mice were administered AAV and allowed free access to drinking water supplemented with AlkK for 7 days. Following AlkK withdrawal, liver samples were collected at designated time points from day 0 to day 7 for analysis. d Immunofluorescence analysis of mouse liver sections at different time points after AlkK withdrawal. Cy5 signals represent newly synthesized proteomes and show a gradual decline over time following AlkK removal. Scale bar, 100 μm. e Quantification of Cy5 fluorescence intensity shown in panel (d). For each group, liver sections from two mice were analyzed. Three random fields per sample were imaged, and the Cy5 signal intensity was measured and normalized to the 0 h time point. Data are the mean ± s.d.; n  =  3. Source data are provided as a Source Data file.
Fig. 3
Fig. 3. Liver-specific nascent proteome identification and analysis in living mice.
a Nascent protein incorporated by AlkK containing an alkyne handle could be labeled by azide-PEG4-Biotin, and then be enriched by streptavidin. The reaction conditions, including extraction method, concentration of Cu2+ and ligand, and reaction time, are optimized to improve the labeling efficiency in the liver extracts. b Labeling and enrichment of the nascent proteins of the whole proteome by western blot. SA-Blot, immunoblotting with streptavidin-HRP. Experiment was independently repeated three times. c Overlap of proteins identified between the control group and SORT-AC group. The proteins that were detected only in the SORT-AC groups were highlighted as SORT-AC Unique. d Volcano plot of the proteins identified in both the control group and SORT-AC group. The dashed lines were under the significance curve parameter of S0 = 0.1 and a false discovery rate <0.05. The proteins significantly enriched were colored in blue and highlighted as SORT-AC Enrich. Statistical significance was assessed using a two-sided, empirical Bayes moderated t-test. e The strategy of identifying SORT-AC Print proteins. f Tissue specific analysis with previously reported dataset among total expressed proteome, total identified proteins, SORT-AC Print, respectively. g Enrichment analysis of SORT-AC Print proteins that major participate pathways with a one-sided Fisher’s exact test. The blue indicated the pathways highly related to liver functions. The resulting p-values were adjusted for multiple hypothesis testing using the Benjamini–Hochberg procedure. h The interaction network analysis of SORT-AC Print proteins. The membrane proteins were colored in green. i The ratio of membrane and transmembrane proteins in SORT-AC Print (top) and the annotation of the subcellular localization of SORT-AC Print membrane proteins (bottom). j Overlap of membrane proteins in SORT-AC Print in mitochondrion, endoplasmic reticulum, and Golgi apparatus. k Overlap of transmembrane proteins in SORT-AC Print in mitochondrion, endoplasmic reticulum, and Golgi apparatus. l Annotation of transmembrane proteins involved in lipid metabolism in SORT-AC Print, which were located in mitochondrion and endoplasmic reticulum. Source data are provided as a Source Data file.
Fig. 4
Fig. 4. Identification of the nascent liver proteome by SORT-AC in ethanol-induced liver injury mouse model.
a Schematic of the acute alcohol gavage mouse model establishing. In the workflow, AAV carried TTR-Cre (100 μL of 1 × 1012 vg/ml per mouse) was orbital injected into C57BL/6J mice on day 0 and administered high-concentration ethanol gavage (4 g/kg) every two days. Meanwhile, a low concentration of ethanol (5%) and AlkK (30 g/L) was dissolved into the drinking water. The liver samples were collected from the mice after 27 days. b The Red Oil O staining of the mouse liver. The mouse without ethanol administered was used as control. The red regions indicated the fat droplets in which ethanol group has significant fat droplets accumulation. Scale bar, 100 μm. c Quantification analysis of (b). Data are the mean ± s.d.; n  =  6 fluorescence images per condition. d The strategy of identifying EtOH-enriched proteins. e Hierarchical clustering of different indicated treatments. f Volcano plot of the proteins identified in both SORT-AC groups with or without acute alcohol gavage treatment. Statistical significance was assessed using a two-sided, empirical Bayes moderated t-test. The dashed lines were under the significance curve parameter of S0 = 0.1 and a false discovery rate <0.05. The proteins significantly enriched were colored in blue and highlighted as EtOH Enrich. g Enrichment analysis of EtOH Enrich proteins that major participate pathways, and the protein interaction network involved in monocarboxylic acid metabolic process. The blue bars indicated the representative pathways related to alcohol metabolism. GO term enrichment was performed using a one-sided Fisher’s exact test. The resulting p-values were adjusted for multiple hypothesis testing using the Benjamini–Hochberg procedure. h The ratio of membrane and transmembrane proteins in EtOH Enrich. i The annotation of the subcellular localization of EtOH Enrich membrane proteins. j The heatmap analysis of EtOH Enriched proteins participated in transcription regulator, xenobiotic metabolism, stress responses, and lipid metabolism. Source data are provided as a Source Data file.
Fig. 5
Fig. 5. Key regulators involved in ethanol-induced liver injury development.
a Overview the major pathways in hepatocytes response to alcohol exposure. EtOH Enriched proteins in SORT-AC were colored in blue and function validated proteins in this study were colored in red. b The mRNA expression levels of genes which regulated by Phb1 or Phb2 using qPCR (bottom) and schematic of the regulation relationship and inhibitor targets (top). Two-sided Student T-test was used to assess the significance of the differences between the corresponding Control group and the Phb1 or Phb2 group. Data are the mean ± s.d.; n  =  3 biologically independent repeats. c Triacsin C could effectively decrease lipid accumulation compared with the same ethanol treatment without Triacsin C using oil red O staining. Representative images of n = 3 experiments. Scale bar, 10 μm. d Schematic of establishing the acute alcohol gavage mouse model with Triacsin C treatment. 4 g/kg of ethanol was administered via gavage and after 8 h, 10 mg/kg of Triacsin C dissolved in 3% DMSO was given to the mouse by gavage every two days. After a week, the mice were fasted for 8 h, then anesthetized and blood was collected. e The schematic of Triacsin C function in protecting liver from lipid accumulation. f Analysis of the Triacsin C treatment group was significantly decreased the AST level. The normality of the data distribution was verified through the Shapiro–Wilk test. Statistical significance and P values were determined using one-way ANOVA with Tukey’s multiple comparison test. Data are the mean ± s.d.; n  =  6 mice. g The Red Oil O staining of the mouse liver. The mouse without Triacsin C administered was used as control. The red regions indicated the fat droplets in which ethanol group showed a significant accumulation. Representative images of n  =  6 mice each group. Scale bar, 100 μm. Source data are provided as a Source Data file.

References

    1. Zakhari, S. Overview: how is alcohol metabolized by the body?. Alcohol Res. Health29, 245–254 (2006). - PMC - PubMed
    1. Seitz, H. K. et al. Alcoholic liver disease. Nat. Rev. Dis. Prim.4, 16 (2018). - PubMed
    1. Gong, J., Tu, W., Liu, J. & Tian, D. Hepatocytes: a key role in liver inflammation. Front. Immunol.13, 1083780 (2022). - PMC - PubMed
    1. Louvet, A. & Mathurin, P. Alcoholic liver disease: mechanisms of injury and targeted treatment. Nat. Rev. Gastroenterol. Hepatol.12, 231–242 (2015). - PubMed
    1. Leung, T. M. & Lu, Y. Alcoholic liver disease: from CYP2E1 to CYP2A5. Curr. Mol. Pharm.10, 172–178 (2017). - PMC - PubMed

MeSH terms

LinkOut - more resources