. 2025 Aug 26;11(1):95.
doi: 10.1038/s41523-025-00808-w.

Single-cell RNA sequencing reveals different cellular states in malignant cells and the tumor microenvironment in primary and metastatic ER-positive breast cancer

Affiliations

Single-cell RNA sequencing reveals different cellular states in malignant cells and the tumor microenvironment in primary and metastatic ER-positive breast cancer

Furkan Ozmen et al. NPJ Breast Cancer. .

Abstract

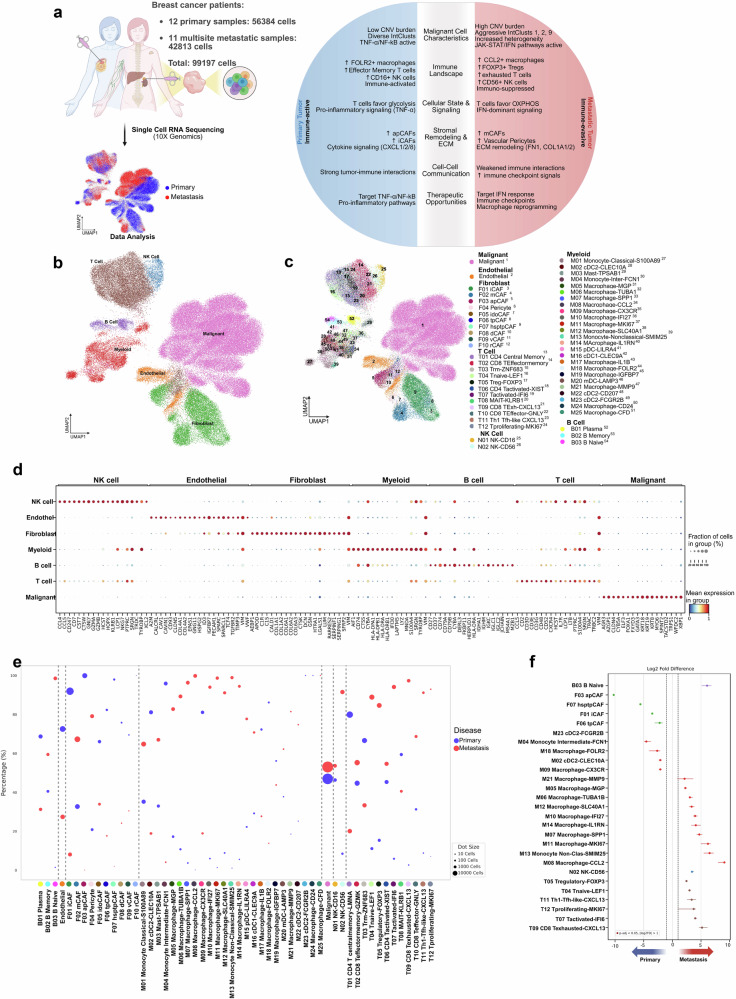
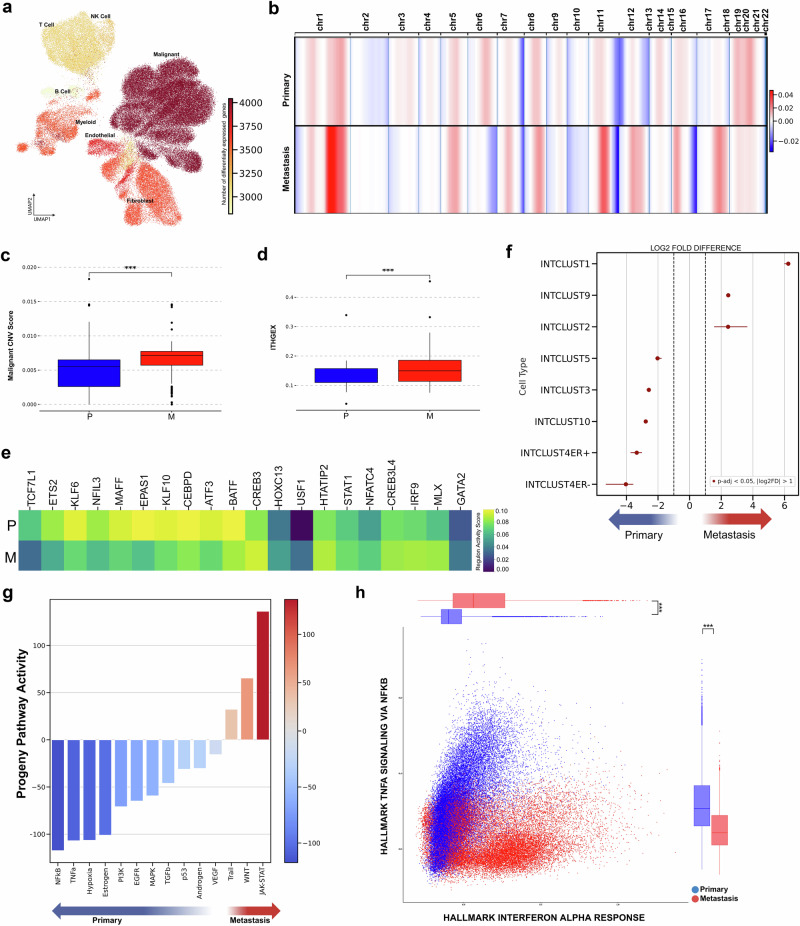
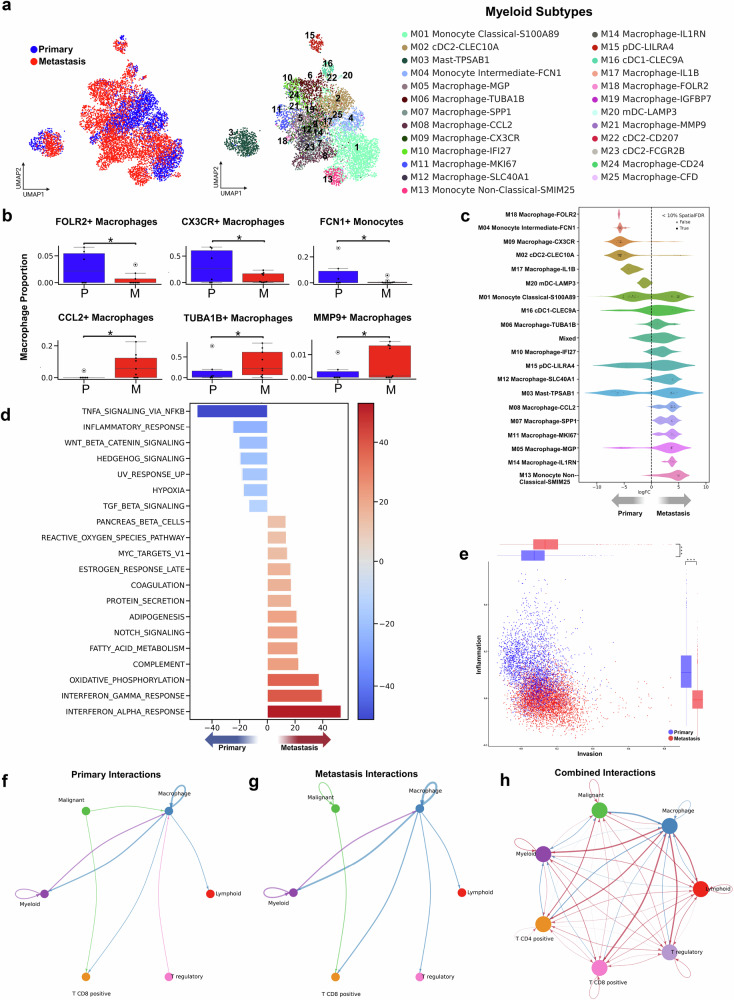
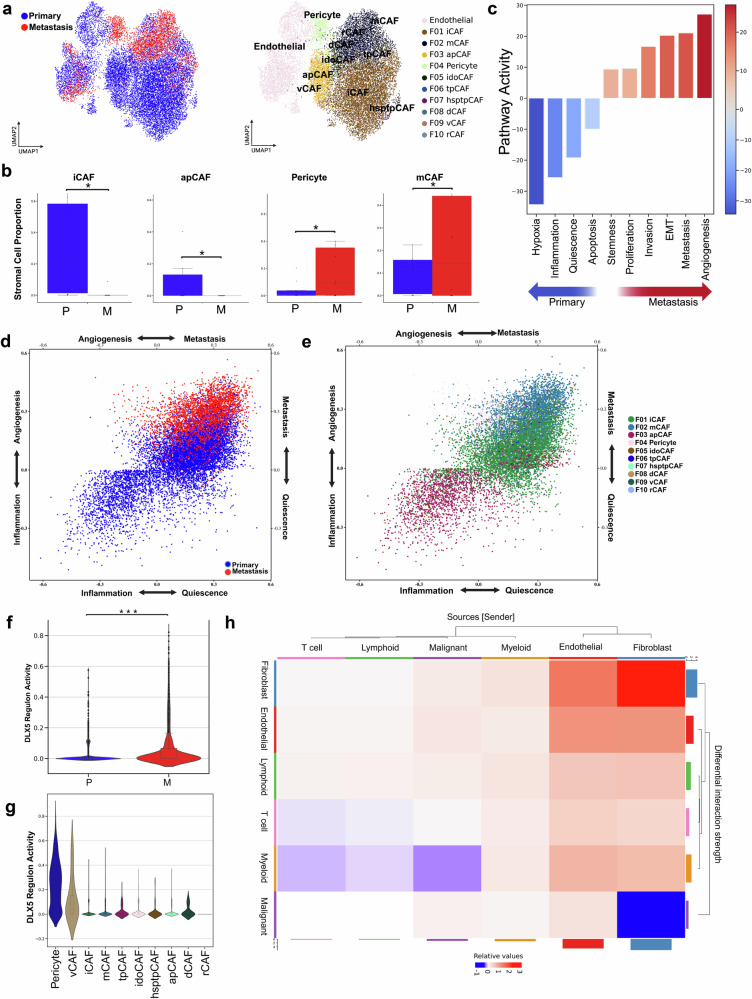
Metastatic breast cancer remains largely incurable, and the mechanisms driving the transition from primary to metastatic breast cancer remain elusive. We analyzed the complex landscape of estrogen receptor (ER)-positive breast cancer primary and metastatic tumors using scRNA-seq data from twenty-three female patients with either primary or metastatic disease. By employing single-cell transcriptional profiling of unpaired patient samples, we sought to elucidate the genetic and molecular mechanisms underlying changes in the metastatic tumor ecosystem. We identified specific subtypes of stromal and immune cells critical to forming a pro-tumor microenvironment in metastatic lesions, including CCL2+ macrophages, exhausted cytotoxic T cells, and FOXP3+ regulatory T cells. Analysis of cell-cell communication highlights a marked decrease in tumor-immune cell interactions in metastatic tissues, likely contributing to an immunosuppressive microenvironment. In contrast, primary breast cancer samples displayed increased activation of the TNF-α signaling pathway via NF-kB, indicating a potential therapeutic target. Our study comprehensively characterizes the transcriptional landscape encompassing primary and metastatic breast cancer.


Conflict of interest statement

Competing interests: Gordon B. Mills serves or has served as a scientific advisory board member or consultant for Amphista, Astex, AstraZeneca, BlueDot, Ellipses Pharmaceuticals, ImmunoMET, Leapfrog Bio, Bruker/Nanostring, Neophore, Nerviano, Nuvectis, Pangea, PDX Pharmaceuticals, Qureator, Rybodyne, Signalchem Lifesciences, Turbine, and Zentalis Pharmaceuticals; holds stock, stock options, or other financial interests in Bluedot, Catena Pharmaceuticals, ImmunoMet, Nuvectis, RyboDyne, SignalChem Lifesciences, and Turbine; is an inventor on licensed technology, including an HRD assay licensed to Myriad Genetics and DSP patents licensed to Nanostring; and has received sponsored research support from AstraZeneca, Zentalis, and Nanostring. The other authors declare no financial or non-financial competing interests.

Figures

Fig. 1
Fig. 1. Single-cell landscape of primary and metastatic ER+ breast cancer: characterization and cellular subtype differences.
a Sample collection workflow and data analysis overview with a summary of key findings (created using BioRender; BioRender.com/y20n356). b UMAP visualization of the unified cell map, showing seven major cell types colored by cluster. c UMAP visualization of the same cell map, displaying 54 minor cell types uniquely colored within the seven major cell types. d Dot plot showing differentially expressed genes across the seven major cell type clusters. e Relative percentage of the 54 minor cell types stratified by metastatic status; dot size indicates the number of cells. f Statistically significant changes in minor cell type proportions between primary and metastatic breast cancer samples.
Fig. 2
Fig. 2. Genomic and phenotypic alterations in malignant cells of primary vs. metastatic breast cancer: insights from CNV analysis, gene regulatory networks, and integrative clusters.
a UMAP visualization showing the number of differentially expressed genes across all major cell type clusters. b Chromosomal copy number variation (CNV) alteration score by metastatic status, with copy number gains and losses represented in red and blue, respectively. c CNV score comparison between malignant cells from primary and metastatic tumors (***p < 0.001). d ITGEX score comparison between malignant cells from primary and metastatic tumors (***p < 0.001). e Regulon activity scores in malignant cells, stratified by metastatic status. f Log2 fold-change analysis of integrative cluster differences between primary and metastatic malignant cells (adjusted p < 0.05). g Differential Progeny pathway activity scores in malignant cells across metastatic status. h Cellular states plot showing Hallmark gene signature activity for Interferon Alpha Response versus TNFα signaling via NF-κB in malignant populations.
Fig. 3
Fig. 3. Distinct myeloid cell populations and their roles in primary and metastatic breast cancer: insights into macrophage polarization and tumor microenvironment interactions.
a UMAP visualizations of 7,651 myeloid cells, colored by tissue class of origin (left) and clustered into 25 subtypes (right), including six dendritic, three monocytic, one mast, and fifteen macrophage lineages. b Bar plots showing the proportions of cells from each tissue class (P = Primary, M = Metastatic) for macrophage subtypes with significant proportion differences (permutation test, p < 0.05, log2FC > 2). c Beeswarm plot illustrating differential abundance analysis of myeloid subtypes across neighborhoods, stratified by tissue class. d Differential Hallmark gene signature pathway activity scores in malignant cells by metastatic status. e Cellular states plot showing CANCERSEA signature activity for Inflammation versus Invasion in myeloid populations. f Circle plot depicting the top 15% of tumor microenvironment interactions in primary tumors; arrow color indicates sender and thickness represents interaction strength. g Circle plot of the top 15% of tumor microenvironment interactions in metastatic tumors. h Comparative circle plot visualizing differential cell-cell interactions; red edges indicate increased interactions in metastatic tumors, and blue edges indicate higher interactions in primary tumors.
Fig. 4
Fig. 4. Lymphoid Cell Landscape and Functional Shifts in Primary vs. Metastatic Breast Cancer Tumors.
a UMAP visualizations of 19,104 lymphoid cells, colored by tissue class (left) and grouped into 17 subtypes (right), including three B cell, two NK cell, and twelve T cell subtypes. b Bar plots showing the proportions of cells from each tissue class for T cell subtypes with significant differences (permutation test, p < 0.05, log2FC > 2). c Beeswarm plot illustrating the abundance differences among NK cell subtypes, stratified by tissue class. d Bar plots showing proportions of B cell subtypes with significant differences between primary and metastatic tissues (permutation test, p < 0.05, log2FC > 2). e Differential Hallmark gene signature activity scores within T cells across metastatic status. f Hypoxia score comparison between T cells from primary and metastatic tumors (***p < 0.001). g OXPHOS score comparison between T cells from primary and metastatic tumors (***p < 0.001). h Circle plot showing the top 10% of predominant interactions in the primary tumor microenvironment; arrow color indicates sender, and thickness represents interaction strength. i Circle plot showing the top 10% of predominant interactions in the metastatic tumor microenvironment.
Fig. 5
Fig. 5. Stromal cell remodeling and fibroblast subtype dynamics in metastatic vs. primary breast cancer tumor microenvironment.
a UMAP visualizations of 17,339 stromal cells, colored by tissue class (left) and grouped into 11 subtypes (right), including 10 fibroblast subtypes and one endothelial cell subtype. b Bar plots showing fibroblast subtypes with significantly different proportions between primary and metastatic tissues (permutation test, p < 0.05, log2FC > 2). c Differential CANCERSEA pathway activity scores in fibroblast cells across metastatic status. d Cellular states plot showing CANCERSEA gene signature activity for Angiogenesis, Metastasis, Inflammation, and Quiescence by metastatic status. e Cellular states plot showing the same signatures across individual fibroblast subtypes. f DLX5 regulon activity score comparison between stromal cells from primary and metastatic tumors (***p < 0.001). g Additional DLX5 regulon activity comparison highlighting consistent significance (***p < 0.001). h Heatmap comparing number and strength of interactions between tumor microenvironments. The top bar plot shows incoming signaling and the right bar plot shows outgoing signaling. Red indicates increases in metastatic tumors; blue indicates increases in primary tumors. Bar height reflects magnitude of change.

References

    1. SEER*Explorer: An interactive website for SEER cancer statistics. SEER Incidence Data, November 2023 Submission (1975-2021).
    1. Allemani, C. et al. Global surveillance of trends in cancer survival 2000–14 (CONCORD-3): analysis of individual records for 37 513 025 patients diagnosed with one of 18 cancers from 322 population-based registries in 71 countries. Lancet391, 1023–1075 (2018). - PMC - PubMed
    1. Valastyan, S. & Weinberg, R. A. Tumor metastasis: molecular insights and evolving paradigms. Cell147, 275–292 (2011). - PMC - PubMed
    1. Mu, X. et al. Tumor-derived lactate induces M2 macrophage polarization via the activation of the ERK/STAT3 signaling pathway in breast cancer. Cell Cycle17, 428–438 (2018). - PMC - PubMed
    1. Bahrami, A. et al. The Therapeutic Potential of Targeting Tumor Microenvironment in Breast Cancer: Rational Strategies and Recent Progress. J. Cell. Biochem.119, 111–122 (2018). - PubMed

LinkOut - more resources