. 2025 Aug 26;16(1):7954.
doi: 10.1038/s41467-025-63351-z.

Helicobacter hepaticus promotes hepatic steatosis through CdtB-induced mitochondrial stress and lipid metabolism reprogramming

Affiliations

Helicobacter hepaticus promotes hepatic steatosis through CdtB-induced mitochondrial stress and lipid metabolism reprogramming

Shanhao Jin et al. Nat Commun. .

Abstract

Host-pathogen interaction influences many non-infectious diseases, including metabolic diseases. Helicobacter hepaticus (H. hepaticus) has been found in some metabolic dysfunction-associated steatotic liver disease (MASLD) patients, however, the causal link and underlying mechanisms remain unclear. Here we report that H. hepaticus infection or overexpression of CdtB of H. hepaticus induces lipid deposition in hepatocytes, both in vivo and in vitro. Furthermore, we identify that CdtB translocates to mitochondria with the help of Hsp90, interacts with ATP5A1, reduces mitochondrial respiratory complex V activity, damages mitochondria, and disrupts lipid metabolism. Mechanistically, CdtB-induced lipogenesis depends on the CdtB-mitochondrial ROS-mTORC1-SREBP1 axis and CdtB-mediated NONO expression to enhance nuclear localization of SREBP1 that promote the de novo fatty acid synthesis in the hepatocytes. Neutralization of CdtB significantly alleviates hepatic lipidosis in mice upon H. hepaticus infection. Furthermore, the nucleic acid of H. hepaticus has been detected in the liver tissues of some patients with MASLD, which suggests a certain correlation between liver infection with H. hepaticus and the occurrence and progression of MASLD. Our findings highlight the critical role of CdtB in the pathogenesis of H. hepaticus infection-induced hepatic lipidosis and its potential as a therapeutic target.


Conflict of interest statement

Competing interests: The authors declare no competing interests.

Figures
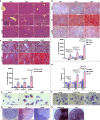
Fig. 1
Fig. 1. H. hepaticus triggers hepatic lipid accumulation and steatosis in a CdtB dependent manner.
a, b H&E (a) and Oil Red O (b) staining of liver sections from mice infected with Mock, wild type (WT) or CdtB knockout (ΔCdtB) H. hepaticus at 1, 3, 5 months post-infection (MPI) (n = 5 mice). c Oil Red O staining of liver sections from mice following tail vein injection with rAd-vector or rAd-CdtB at 17, 42, 60 days post-infection (DPI) (n = 5 mice). d Serum triglyceride (TG) levels in mice with Mock, WT or ΔCdtB H. hepaticus infection (n = 5 mice). e, f Oil Red O staining of Huh-7 cells infected with WT or ΔCdtB H. hepaticus (e) or transfected with pCMV or pCMV-CdtB (f) in a dose-dependent manner for 24 h. g, h Oil Red O staining of mouse liver organoids infected with WT or ΔCdtB H. hepaticus (g) or treated with CdtA/C or holotoxin CDT (h) for 48 h. Scale bars:50 µm (b, c, g, h) or 100 µm (a, e, f). Statistical analysis was performed by two-way ANOVA followed by Dunnett’s multiple comparisons test (bd). Source data are provided as a Source Data file.
Fig. 2
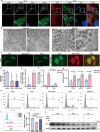
Fig. 2. Mitochondrial dysfunction and lipid metabolism disorder induced by CdtB in hepatocytes.
a Immunofluorescence images of mitochondrial morphology (TOM20, green) in Hep3B cells transfected with pCMV-vector or pCMV-CdtB (CdtB mAb, red) for 24 h. b Transmission electron microscopy images of liver sections from mice with rAd-vector or rAd-CdtB tail vein injection (i.v.) at 7 days post-infection (DPI). Red triangle: Damaged mitochondria with loss of ridges and reduced inner and outer membrane integrity; Yellow triangle: Lipid droplet; Green triangle: Autophagosome; Blue triangle: Autophagosome containing damaged mitochondria; Purple triangle: Autolysosome. c MitoSOX Red staining of mitochondrial superoxides in HEK293A cells transfected with pCMV or pCMV-EGFP-CdtB. d ATP production in Huh-7 cells transfected with pCMV-vector, pCMV-CdtB or pCMV-COX8A-CdtB for 24 h (n = 3 independent experiments). e, f Analysis of mitochondrial DNA (mtDNA) in purified cytoplasmic fractions of Hep3B cells transfected with pCMV or pCMV-CdtB (e), followed by treatment with vehicle control (NC) or CsA (500 ng/mL) (f) for 24 h (n = 3 independent experiments). g Serum mtDNA level following intravenous administration of mice with rAd-vector or rAd-CdtB (n = 5 mice). h Flow cytometry analysis of Hep3B cell death labeled with propidium iodide (PI) following various treatments. i Flow cytometry analysis of mitochondrial membrane potential by tetramethylrhodamine methyl ester (TMRM) in Hep3B cells (n = 3 independent experiments) transfected with pCMV-EGFP or pCMV-EGFP-CdtB or treated with cis-Platinum (CDDP) (10 μM) for 24 h. j Western blot analysis of CPT1a expression of Hep3B cells infected with wild type (WT), or CdtB knockout (ΔCdtB) H. hepaticus. Scale bars represent 2 μm (b, original) or 1 μm (b, enlarged), 10 µm (a) or 50 µm (c). Statistical analysis was determined by one-way ANOVA (d, i), two-way ANOVA (f, g) followed by Dunnett’s multiple comparisons test, or unpaired two-tailed Student’s t test (e). Source data are provided as a Source Data file.
Fig. 3
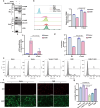
Fig. 3. CdtB-induced mitochondrial damage through the interaction with ATP5A1 along with the decreased activity of mitochondrial respiratory complex V.
a Live cell images of Hep3B cells transfected with pBIFC-COX8A-VN173, pBIFC-CdtB-VC155 and pBIFC-C. j-CdtB-VC155 along with their corresponding reverse validation plasmids. b Western blot analysis of CdtB content in mitochondrial fractions. Hep3B cells were transfected with either pCMV-Myc-EGFP or pCMV-Myc-EGFP-CdtB for 24 h. Whole-cell lysates (cell), cytoplasmic (cyto), and mitochondrial components (mito) were probed with CTCF, β-actin, and TOM20 antibody, respectively. c Co-immunoprecipitation (Co-IP) assay of the interaction between CdtB and ATP5A1 in Hep3B cells transfected with pCMV-Myc-EGFP or pCMV-Myc-EGFP-CdtB. d Immunofluorescence images of the subcellular localization of CdtB (green) and ATP5A1 (red) in Hep3B cells transfected with pCMV-vector or pCMV-CdtB for 24 h. e The activity of mitochondrial respiratory complex V in Hep3B cells transfected with pCMV-vector or pCMV-CdtB for 24 h (n = 3 independent experiments). Scale bars: 10 µm (d) or 50 µm (a). Statistical analysis was performed using unpaired, two-tailed Student’s t test (e). Source data are provided as a Source Data file.
Fig. 4
Fig. 4. CdtB-induced mitochondrial damage is attributed to the transportation with the assistance of Hsp90.
a The interaction between CdtB and Hsp90 in Hep3B cells. The cells were transfected with pCMV-Myc-EGFP or pCMV-Myc-EGFP-CdtB for 24 h prior to co-immunoprecipitation analysis (co-IP) assay. bf 17-AAG inhibits CdtB-induced mitochondrial damage, as reflected by preservation of mitochondrial membrane potential (b), reduced cytosolic mtDNA levels (c), restored ATP production (d), decreased cell death (e) and suppression of mitochondrial ROS accumulation (f). Hep3B (be) or HEK293A (f) cells were treated with a vehicle control (NC) or 17-AAG (500 nM) for 12 h, followed by transfection with pCMV-EGFP or pCMV-EGFP-CdtB for an additional 24 h (n = 3 independent experiments). TMRM tetramethylrhodamine methyl ester, PI propidium iodide, DHE dihydroethidium. g 17-AAG restores CdtB-impaired mitochondrial β-oxidation capacity. Hep3B cells were treated as described above. Rotenone and cis-Platinum (CDDP) served as positive controls for mitochondrial and nuclear DNA damage, respectively (n = 3 independent experiments). Scale bar: 50 μm (f). Statistical significance was determined using the two-way ANOVA followed by Dunnett’s multiple comparisons test (bd, g). Source data are provided as a Source Data file.
Fig. 5
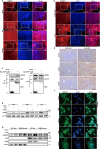
Fig. 5. SREBP1 activation mediated by CdtB-induced mitochondrial damage.
a Immunohistochemistry analysis of SREBP1 distribution in the liver tissues of mice infected with rAd-vector or rAd-CdtB at 17, 42, 60 days post-infection (DPI). b, c Quantitative analysis of SREBP1 mRNA (b) and protein (c) levels of Hep3B cells infected with wild type (WT) or CdtB knockout (ΔCdtB) H. hepaticus (n = 3 independent experiments). d, e Immunofluorescence analysis (d) or Western blot (e) of SREBP1 or nSREBP1 (nuclear SREBP1) in Hep3B cells. The cells were transfected with pCMV or pCMV-CdtB, and subsequently treated with 100 nM rapamycin or 100 μM MitoTEMPO for 24 h. f Western blot analysis of mTOR and p70S6K phosphorylation in Hep3B cells infected with WT or ΔCdtB H. hepaticus. Scale bars: 50 µm (d) or 100 µm (a). Statistical significance was determined using the two-way ANOVA followed by Dunnett’s multiple comparisons test (b). Source data are provided as a Source Data file.
Fig. 6
Fig. 6. CdtB activates SREBP1 via mitochondria-mediated mTOR/P70S6K signaling pathway and the interaction with NONO.
a, b Immunofluorescence images of SREBP1 in mouse liver organoids infected with wild type (WT) or CdtB knockout (ΔCdtB) H. hepaticus (a) or treated with CdtA/C or holotoxin CDT (b) for 48 h. c Co-immunoprecipitation assay demonstrating the interaction between CdtB and NONO in Hep3B cells. Cells were transfected with either pCMV-Myc-EGFP or pCMV-Myc-EGFP-CdtB for 24 h prior to immunoprecipitation. d Immunohistochemical detection of γH2AX in liver sections from mice administered rAd-vector or rAd-CdtB at 17, 42, 60 days post-infection (DPI). e Western blot analysis of NONO expression in Hep3B cells following infection with WT or ΔCdtB H. hepaticus. f Immunofluorescence images of SREBP1 in Hep3B cells with either NONO overexpression or NONO knockout, transfected with pCMV or pCMV-CdtB. g Western blot analysis of SREBP1 in nuclear fractions of Hep3B cells and Hep3B NONO-knockout cells transfected with pCMV-Myc-EGFP or pCMV-Myc-EGFP-CdtB for 24 h. Cytoplasmic (cyto) and nuclear components (nuc) were probed with β-actin and CTCF antibodies, respectively. Scale bars: 20 µm (a, b), 50 µm (f) or 100 µm (d). Source data are provided as a Source Data file.
Fig. 7
Fig. 7. CdtB mAb alleviates hepatic lipidosis caused by H. hepaticus.
a, b H&E-stained (a) or Oil Red O-stained (b) liver sections from mock- or H. hepaticus (H. h)-infected mice, with or without CdtB mAb treatment, at 1, 3, 5  months post-infection (MPI). c Cell cycle assay of Hep3B cells treated with CdtB in the presence or absence of CdtB mAb (n = 3 independent experiments). d Protein detection and semi-quantitative analysis of NONO, SREBP1 and nucleus SREBP1 of mice treated with H. hepaticus, H. hepaticus + CdtB mAb or Mock + CdtB mAb at 5 MPI (n = 3 mice). Scale bars: 50 µm (b) or 100 µm (a). Statistical significance was determined using the one-way ANOVA followed by Dunnett’s multiple comparisons test (c, d). Source data are provided as a Source Data file.
Fig. 8
Fig. 8. The nucleic acid of H. hepaticus is present in the liver of MASLD patients.
RNA fluorescence in situ hybridization (FISH) targeting H. hepaticus 16S rRNA in liver tissues form one transplant donor and one MASLD patient. H. hepaticus (H.h) specific probe, labeled with Cy3 at 5’ end, was used to detect bacterial 16S rRNA, while DAPI was employed for nuclear counterstaining, scale bar: 25 μm.
Fig. 9
Fig. 9. The mode diagram of H. hepaticus infection promoting lipid deposition in hepatocytes.
H. hepaticus is transported from the portal vein to the liver, releasing CDT around hepatocytes. Upon binding to cell surface receptors, the subunit CdtB is internalized into hepatocytes. In a process facilitated by Hsp90, CdtB is trafficked to mitochondria, where it interacts with ATP5A1, a core component of mitochondrial respiratory complex V, thereby inducing mitochondrial dysfunction, characterized by mitochondrial DNA release, elevated oxidative stress, diminished ATP production, and suppression of β-oxidation. This process can be impeded by the Hsp90 inhibitor, 17-AAG. The resultant increase in mitochondrial reactive oxygen species (mtROS) activates the mTORC1/P70S6K/SREBP1 signaling pathway, driving SREBP1 maturation and nucleus translocation. This activation promotes de novo lipogenesis, a process susceptible to inhibition by rapamycin. Additionally, a fraction of CdtB enter the nucleus, causing DNA damage and upregulating the expression of NONO, which stabilizes nuclear SREBP1 and sustains the transcriptional upregulation of lipogenic genes (Created in BioRender. Xia, L. (2025) https://BioRender.com/qwsavjs).

References

    1. Blouin, A., Bolender, R. P. & Weibel, E. R. Distribution of organelles and membranes between hepatocytes and nonhepatocytes in the rat liver parenchyma. A stereological study. J. Cell Biol.72, 441–455 (1977). - PMC - PubMed
    1. Di Ciaula, A. et al. Nonalcoholic Fatty Liver Disease (NAFLD). Mitochondria as players and targets of therapies?. Int J. Mol. Sci.22, 5375 (2021). - PMC - PubMed
    1. Huttasch, M., Roden, M. & Kahl, S. Obesity and MASLD: Is weight loss the (only) key to treat metabolic liver disease?. Metabolism157, 155937 (2024). - PubMed
    1. Ji, Y., Yin, Y., Sun, L. & Zhang, W. The molecular and mechanistic insights based on gut-liver axis: nutritional target for Non-Alcoholic Fatty Liver Disease (NAFLD) Improvement. Int J. Mol. Sci.21, 3066 (2020). - PMC - PubMed
    1. Sharpton, S. R., Schnabl, B., Knight, R. & Loomba, R. Current concepts, opportunities, and challenges of gut microbiome-based personalized medicine in Nonalcoholic Fatty Liver Disease. Cell Metab.33, 21–32 (2021). - PMC - PubMed

MeSH terms

Substances