. 2025 Aug 26;16(1):7948.
doi: 10.1038/s41467-025-63167-x.

Programmable epigenome editing by transient delivery of CRISPR epigenome editor ribonucleoproteins

Affiliations

Programmable epigenome editing by transient delivery of CRISPR epigenome editor ribonucleoproteins

Da Xu et al. Nat Commun. .

Abstract

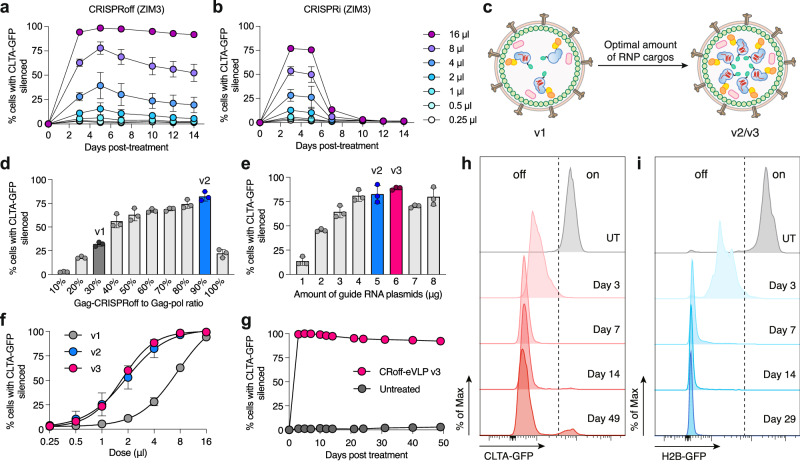
Programmable epigenome editors modify gene expression in mammalian cells by altering the local chromatin environment at target loci without inducing DNA breaks. However, the large size of CRISPR-based epigenome editors poses a challenge to their broad use in biomedical research and as future therapies. Here, we present Robust ENveloped Delivery of Epigenome-editor Ribonucleoproteins (RENDER) for transiently delivering programmable epigenetic repressors (CRISPRi, DNMT3A-3L-dCas9, CRISPRoff) and activator (TET1-dCas9) as ribonucleoprotein complexes into human cells to modulate gene expression. After rational engineering, we show that RENDER induces durable epigenetic silencing of endogenous genes across various human cell types, including primary T cells. Additionally, we apply RENDER to epigenetically repress endogenous genes in human stem cell-derived neurons, including the reduction of the neurodegenerative disease associated V337M-mutated Tau protein. Together, our RENDER platform advances the delivery of CRISPR-based epigenome editors into human cells, broadening the use of epigenome editing in fundamental research and therapeutic applications.


Conflict of interest statement

Competing interests: J.K.N. and D.X. have submitted a patent application to U.S. Provisional Patent Office related to the delivery of CRISPR components, as part of this work (application No. 63/686,584). J.K.N. is an inventor of patents related to the CRISPRoff/on technologies, filed by The Regents of the University of California. B.R.C. is a founder of Tenaya Therapeutics and holds equity in the company. The remaining authors declare no competing interests.

Figures

Fig. 1
Fig. 1. Virus-like particle delivery of epigenome editor RNPs.
a Schematic of a virus-like particle packaging epigenome editors. b Schematic overview of different CRISPR-based epigenome editors and their sizes. kb; kilobase pairs. cS. pyogenes Cas9 (spCas9) protein quantifications of CRISPRoff-eVLP collected at 48 h and 72 h post-transfection. Protein contents were measured by anti-Cas9 ELISA. Data are shown as individual data points and mean ± SD for n = 3 biological replicates. d Western blot evaluating the packaging of CRISPRoff protein in eVLPs at 4, 2 and 1 μl of concentrated CRISPRoff-eVLP with anti-Flag antibody. CRoff; CRISPRoff. e Schematic of engineered virus-like particle transduction and CLTA-GFP silencing in HEK293T reporter cells. f Quantification of CLTA-GFP silencing in HEK293T cells 3 days post-treatment with different epigenome editor eVLPs (16 μl). g Representative flow cytometry plots of CLTA-GFP expression in HEK293T cells at day 3 and 14 post-treatment with CRISPRi-eVLPs and CRISPRoff-eVLPs (16 μl). h Time course of CLTA-GFP silencing in HEK293T cells post-treatment with different epigenome editor eVLPs (16 μl). Values and error bars reflect mean ± SD of n = 3 biological replicates. i Schematic of engineered virus-like particle transduction and CLTA-GFP reactivation in HEK293T reporter cells. j Time course of CLTA-GFP reactivation in HEK293T cells post-treatment with RENDER-TET1-dCas9 (32 μl). Values and error bars reflect mean ± SD of n = 3 biological replicates. k Representative flow cytometry plots of CLTA-GFP expression in HEK293T cells 15 days post-treatment with RENDER-TET1-dCas9 (32 μl). Data are shown as individual data points and mean ± SD for n = 3 biological replicates. Source data are provided as a Source Data file.
Fig. 2
Fig. 2. Optimizing RENDER-CRISPRoff composition.
a Time course of CLTA-GFP silencing in HEK293T cells post-treatment with different doses of RENDER-CRISPRoff (ZIM3) (v1). b Time course of CLTA-GFP silencing in HEK293T cells post-treatment with different doses of RENDER-CRISPRi (ZIM3). In a, b, Values and error bars reflect mean ± SD of n = 3 biological replicates. c, Schematic of optimization of RENDER-CRISPRoff. d Quantification of CLTA-GFP silencing in HEK293T cells 5 days post-treatment with 4 μl RENDER-CRISPRoff with varying gag-CRISPRoff to gag-pol plasmid ratios. X-axis indicates % gag-CRISPRoff plasmid of total amount of gag-CRISPRoff and gag-pol plasmids. Dark gray indicates v1, blue indicates v2. e Quantification of CLTA-GFP silencing in HEK293T cells 5 days post-treatment with 4 μl RENDER-CRISPRoff with varying amounts of sgRNA expressing plasmid. Blue indicates v2, magenta indicates v3. f Dose-response curve of CLTA-GFP silencing in HEK293T cells 5 days post-treatment with RENDER-CRISPRoff v1, v2 and v3. Values and error bars reflect mean ± SD of n = 3 biological replicates. Data were fit to four-parameter logistic curves using nonlinear regression. g Time course of CLTA-GFP silencing in HEK293T cells post-treatment with RENDER-CRISPRoff v3 (16 μl). Values and error bars reflect mean ± SD of n = 3 biological replicates. h Representative histogram plots of CLTA-GFP expression in HEK293T cells at day 3, 7, 14, and 49 post-treatment with RENDER-CRISPRoff v3 (16 μl). UT; untreated. i Representative histogram plots of H2B-GFP expression in HEK293T cells at day 3, 7, 14, and 29 post-treatment with RENDER-CRISPRoff v3 (10 μl). UT; untreated. Source data are provided as a Source Data file.
Fig. 3
Fig. 3. Multiplexed epigenetic silencing across diverse human cell types with RENDER-CRISPRoff.
a Quantification of CD55 and CD81 silencing in different cell lines 7 days post-treatment with RENDER-CRISPRoff v3 (8 μl). Data are shown as individual data points and mean ± SD for n = 3 biological replicates. n.e.; not expressed. b Manhattan plot displaying differentially methylated CpGs between Jurkat cells treated with RENDER-CRISPRoff v3 targeting CD55 and untreated cells (14 days post-treatment) analyzed by WGEM-seq. Magenta dots represent CpGs that are more methylated in RENDER-CRISPRoff-treated cells and blue dots represent CpGs that are more methylated in untreated cells. The arrow denotes the genomic location of the CD55 gene. c Plot displaying the % of WGEM-seq reads that are methylated at each CpG across a ± 2 kilobase pairs window from the CD55 transcription start site (TSS) between Jurkat cells treated with RENDER-CRISPRoff v3 targeting CD55 (magenta) or untreated cells (blue) at 14 days posttreatment. Annotated CpG island (CGI) is shown in green and CD55 targeting sgRNA in red. d Volcano plot of RNA-seq data analyses showing differential gene expression between RENDER-CRISPRoff CD55-sgRNAs treated Jurkat cells and untreated Jurkat cells (n = 2). The adjusted p value is a two-sided p value calculated from a DESeq2 Wald test with Benjamini–Hochberg multiple comparisons adjustment. CD55 is shown as a red dot; all other genes are shown as light gray circles. e Volcano plot of RNA-seq data analyses showing differential gene expression between RENDER-CRISPRoff CLTA-sgRNAs treated HEK293T cells and untreated HEK293T cells (n = 2). The adjusted p value is a two-sided p value calculated from a DESeq2 Wald test with Benjamini–Hochberg multiple comparisons adjustment. CLTA is shown as a red dot; all other genes are shown as light gray circles. f Schematic of combinatorial sgRNAs packaging into one RENDER virus-like particle. g Representative flow cytometry plots of CD55 and CD81 expression in Jurkat cells 7 days post-treatment with combinatorial RENDER-CRISPRoff v3 targeting CD55 and CD81 (8 μl). h Representative flow cytometry plots of CD55 and CD81 expression in U-87 MG cells 7 days post-treatment with combinatorial RENDER-CRISPRoff v3 targeting CD55 and CD81 (8 μl). i Quantification of CLTA-GFP silencing in HEK293T cells 3 days post-treatment of 1.0 × 106 cells with different doses of RENDER-CRISPRoff v3. Data are shown as individual data points and mean ± SD for n = 2 biological replicates. j Quantification of CD55 and CD81 silencing in Jurkat cells 3 days post-treatment of 5.0 × 105 cells with different doses of RENDER-CRISPRoff v3. Values represent one biological replicate. k Schematic of sgRNA-free delivery of CRISPRoff apoprotein by RENDER and CLTA-GFP silencing in HEK293T reporter cells stably expressing a CLTA targeting sgRNA. l Dose-response curve of CLTA-GFP silencing in HEK293T cells expressing a CLTA targeting sgRNA 3 days post-treatment with sgRNA-free RENDER-CRISPRoff. Values and error bars reflect mean ± SD of n = 3 biological replicates. Data were fit to four-parameter logistic curves using nonlinear regression. Source data are provided as a Source Data file.
Fig. 4
Fig. 4. Epigenome editing in primary human T cells.
a Schematic of RENDER-CRISPRoff treatment and electroporation of isolated primary human T cells. b Representative flow cytometry plot showing the viability of T cells 2 days post RENDER-CRISPRoff v3 or CRISPRoff-mRNA nucleofection with a CD55 targeting sgRNA. c Quantification of live T cells 2 days post RENDER-CRISPRoff v3 or CRISPRoff-mRNA electroporation, with CD55 targeting or non-targeting (NT) sgRNA. The data were normalized to the untreated control group. Data are shown as individual data points and mean ± SD for n = 2 (untreated cells and mRNA (NT) treated cells), or n = 3 (RENDER treated cells and mRNA (CD55) treated cells). Error bars represent the standard deviation. d Representative histogram plots of CD55 expression in T cells at 2 and 11 days post-treatment with RENDER-CRISPRoff v3 (5 μl) targeting CD55 (orange) or non-targeting (gray). Percentages denote % cells with CD55 silenced. e Representative histogram plots of CD55 expression in T cells at 2 and 11 days post-electroporation with CRISPRoff-mRNA and CD55 targeting (orange) or non-targeting (gray) sgRNA. Percentages denote % cells with CD55 silenced. f Quantification of CD55 silencing in primary human T cells 5 days post-treatment with different doses of RENDER-CRISPRoff v3 with CD55-sgRNAs or RENDER-CRISPRoff v3 (4 μl) with non-targeting sgRNA (NT). Data are shown as individual data points and mean ± SD for n = 3 biological replicates. g Quantification of CD81 silencing in primary human T cells 5 days post-treatment with different doses of RENDER-CRISPRoff v3 with CD81-sgRNAs or RENDER-CRISPRoff v3 (4 μl) with non-targeting sgRNA (NT). Data are shown as individual data points and mean ± SD for n = 3 biological replicates. Source data are provided as a Source Data file.
Fig. 5
Fig. 5. Epigenome editing iPSC-derived neurons with RENDER.
a Experimental workflow of gene silencing by RENDER-CRISPRoff v3 in iPSC-derived neurons. b Representative histogram plots of CD81 expression in iPSC-derived neurons (wild-type, WT) at day 7 and 14 post-treatment with different doses of RENDER-CRISPRoff v3 targeting CD81 or non-targeting (NT). c Quantification of CD81 expression in iPSC-derived neurons (wild-type, WT) at day 7 and 14 post-treatment with different doses of RENDER-CRISPRoff v3 targeting CD81. CD81 expression is measured by antibody staining and flow cytometry and normalized to non-targeting (NT) control. Data are shown as individual data points and mean ± SD for n = 2 (RENDER-CRISPRoff v3 NT treated neurons), or n = 4 (RENDER-CRISPRoff v3 targeting CD81 treated neurons). Error bars represent the standard deviation. d Representative histogram plots of Tau expression in iPSC-derived neurons (V337M mutant) at day 8 and 15 post-treatment with different doses of RENDER-CRISPRoff v3 targeting MAPT or non-targeting (NT). e Quantification of Tau expression in iPSC-derived neurons (V337M mutant) at day 8 and 15 post-treatment with different doses of RENDER-CRISPRoff v3 targeting MAPT. Tau expression is measured by antibody staining and flow cytometry and normalized to non-targeting (NT) control. Data are shown as individual data points and mean ± SD for n = 2 (RENDER-CRISPRoff v3 NT treated neurons), or n = 4 (RENDER-CRISPRoff v3 targeting MAPT treated neurons). Error bars represent the standard deviation. Source data are provided as a Source Data file.

Update of

References

    1. Wang, D., Zhang, F. & Gao, G. CRISPR-based therapeutic genome editing: strategies and in vivo delivery by AAV vectors. Cell181, 136–150 (2020). - PMC - PubMed
    1. Doudna, J. A. The promise and challenge of therapeutic genome editing. Nature578, 229–236 (2020). - PMC - PubMed
    1. Villiger, L. et al. CRISPR technologies for genome, epigenome and transcriptome editing. Nat. Rev. Mol. Cell Biol.25, 464–487 (2024). - PubMed
    1. Cullot, G. et al. CRISPR-Cas9 genome editing induces megabase-scale chromosomal truncations. Nat. Commun.10, 1136 (2019). - PMC - PubMed
    1. Enache, O. M. et al. Cas9 activates the p53 pathway and selects for p53-inactivating mutations. Nat. Genet.52, 662–668 (2020). - PMC - PubMed

LinkOut - more resources