. 2025 Aug 26;11(1):261.
doi: 10.1038/s41531-025-01084-y.

Differential role of C-terminal truncations on alpha-synuclein pathology and Lewy body formation

Affiliations

Differential role of C-terminal truncations on alpha-synuclein pathology and Lewy body formation

Anne-Laure Mahul-Mellier et al. NPJ Parkinsons Dis. .

Abstract

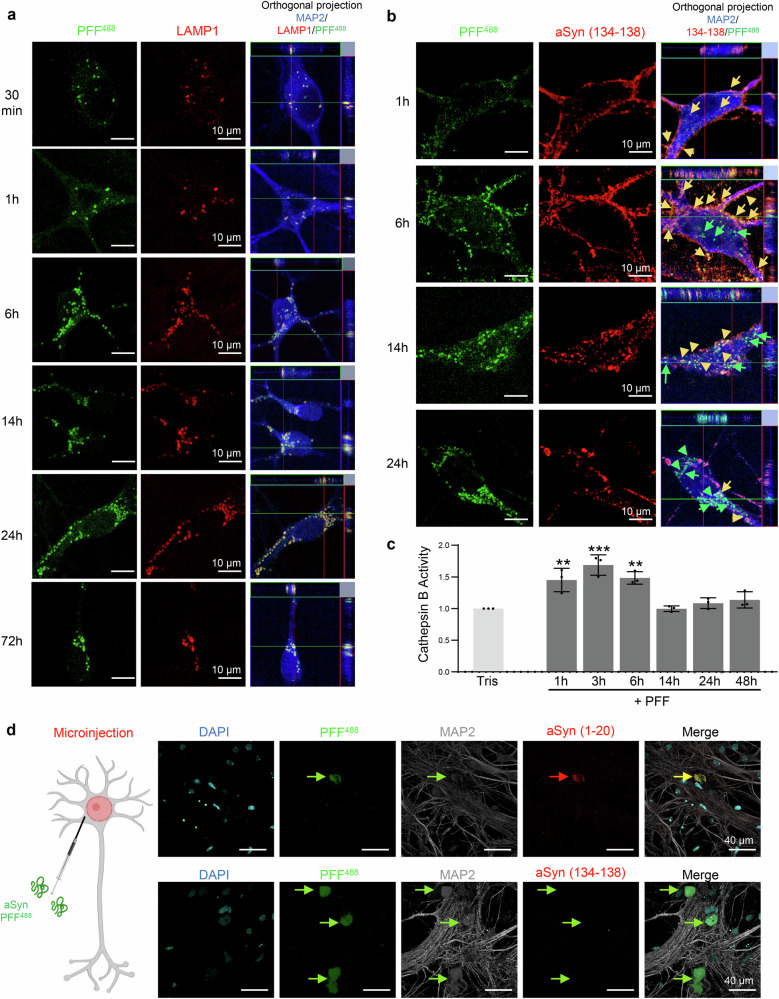
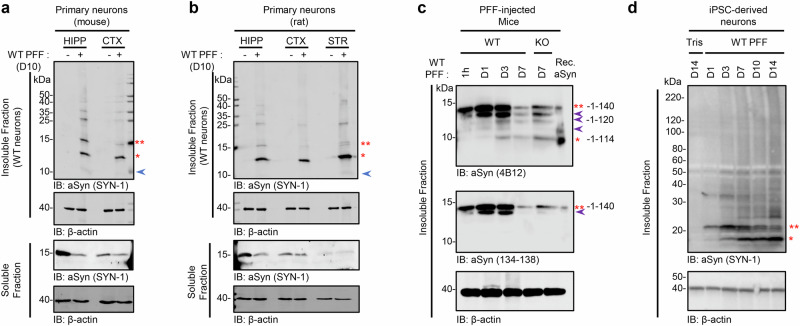
Alpha-synuclein (aSyn) post-translational modifications (PTM), especially phosphorylation at serine 129 and C-terminal truncations, are highly enriched in Lewy bodies (LB), Lewy neurites, and other pathological aggregates in Parkinson's disease and synucleinopathies. However, the precise role of these PTM in pathology formation, neurodegeneration, and pathology spreading remains unclear. Here, we systematically investigated the role of post-fibrillization C-terminal aSyn truncations in regulating uptake, processing, seeding, and LB-like inclusion formation using a neuronal seeding model that recapitulates LB formation and neurodegeneration. We show that C-terminal cleavage of aSyn fibrils occurs rapidly post exogenous fibril internalization and during intracellular LB-like inclusion formation. Blocking cleavage of internalized fibrils does not affect seeding, but inhibiting enzymes such as calpains 1 and 2 alters LB-like inclusion formation. We show that C-terminal truncations, along with other PTMs, regulate fibril interactome remodeling, shortening, lateral association, and packing. These findings reveal distinct roles of C-terminal truncations at different aggregation stages on the pathway to LB formation, highlighting the need for consideration of stage‑specific strategies to target aSyn proteolytic cleavages.


Conflict of interest statement

Competing interests: G.M.C., A.M., P.D., and M.C. are employees of UCB Pharma. H.A.L. is the co-founder and chief scientific officer of ND BioSciences, Epalinges, Switzerland, a company that develops diagnostics and treatments for neurodegenerative diseases (NDs) based on platforms that reproduce the complexity and diversity of proteins implicated in NDs and their pathologies. H.A.L. has received funding from industry to support research on neurodegenerative diseases, including Merck Serono, UCB, and AbbVie. These companies had no specific role in the conceptualization, preparation, and decision to publish this manuscript. H.A.L. is the associate editor of npj Parkinson’s Disease. H.A.L. was not involved in the journal’s review of, or decisions related to, this manuscript. All other authors declare no competing financial interests in association with this manuscript.

Figures

Fig. 1
Fig. 1. C-terminal truncation of exogenous PFFs is an early event during the seeding process.
a Seeding model in primary hippocampal neurons. 70 nM of mouse PFF were added to neurons at DIV 5 (days in vitro). Control neurons were treated with Tris buffer (Tris) used to prepare PFF. After 4 days of treatment, positive pS129-aSyn aggregates were detected in the extension of the neurons. After 7 days of treatment, the aggregates appeared in the cytosol of the neurons. The number of LB-like inclusions increased over time, as shown at 10 days of treatment. Scale bars = 40 and 5 μm. ICC analysis of the LB-like inclusions formed 10 days after adding mouse PFF to aSyn KO neurons (b) or WT neurons (ce). Aggregates were detected using pS129 (MJF-R13) in combination with total aSyn (c, SYN-1), ubiquitin (ub, d), or p62 (e) antibodies. Neurons were counterstained with microtubule-associated protein (MAP2) antibody, and the nucleus was counterstained with DAPI staining. Scale bars = 5 μm. f WB analyses of the insoluble fraction of PFF-treated WT neurons treated with 70 nM of PFF for D1, D2, D4, D7, and D10. Control neurons were treated with Tris. After sequential extractions of the soluble and insoluble fractions, cell lysates were analyzed by immunoblotting. Total aSyn, pS129, and actin were detected by SYN-1, pS129 (MJF-R13), and actin antibodies, respectively. WB band intensities of total aSyn (15 kDa, indicated by a double red asterisk; 12 kDa indicated by a single red asterisk or HMW) or pS129-aSyn were quantified by densitometry, normalized to actin levels, and expressed as fold change relative to D1. Purple arrows indicate the intermediate aSyn-truncated fragments. The graphs represent the mean ± SD of 3 independent experiments. *p < 0.01, ***p < 0.0001 (ANOVA followed by Tukey HSD post hoc test, Tris vs. PFF-treated neurons) and #p < 0.01, ##p < 0.001 (ANOVA followed by Tukey HSD post hoc test, PFF-treated neurons D1 vs. other time point). g Epitope mapping of antibodies raised against the NAC, N-terminal, or C-terminal domains of aSyn. h N-terminal antibodies raised against residues 1–5 or residues 1–20 could detect full-length (15 kDa, indicated by a double red asterisk) or truncated (~12 kDa, indicated by a single red asterisk) aSyn in the insoluble fraction of WT neurons treated with 70 nM of PFF up to D10. Only the LASH-EGT 1–20 was able to detect the HMW at 25, 35, and 40 kDa. i Mapping of the C-terminal cleaved product using antibodies raised against the NAC and the C-terminal domains of aSyn. Immunoblots of insoluble fractions of WT neurons treated with aSyn PFF up to D10 showed that the fragment 1–114 generated in these neurons was well recognized by the NAC antibodies [(FL-140; 61–95) and (SYN-1; 91–99)] and a C-terminal antibody raised against the residues 108–120. However, it was not recognized by antibodies raised against peptides bearing residues after 116 in the C-terminal domain [(ab6162; 116–131); (ab131508; 134–138) and (ab52168; 131–135)]. j WB analyses of the insoluble fractions of aSyn KO primary neurons treated with 70 nM of mouse PFF for up to 48 h using SYN-1 and pS129 (MJF-R13) antibodies. WB band intensities of total aSyn (15 kDa, indicated by a double red asterisk) and C-terminally cleaved aSyn species (12 kDa, indicated by a single red asterisk) were quantified by densitometry, normalized to actin levels, and expressed as fold change relative to 1 h (for the 15 kDa species, *p < 0.0001; ANOVA followed by Tukey HSD post hoc test) or 48 h (for the 12 kDa species, ###p < 0.0001; ANOVA followed by Tukey HSD post hoc test) after PFF addition. Purple arrows indicate intermediate aSyn-truncated fragments. Graphs represent the mean ± SD from three independent experiments. k, l Insoluble fractions of aSyn KO primary neurons treated with 70 nM of mouse PFF for 4 or 14 h were separated on a 16% Tricine gel. After Coomassie staining, two bands at ~15 (indicated by a black dashed box) and 12 kDa (indicated by a purple dashed box) were extracted from 16% Tricine gels (See Supplementary Fig. 4). Isolated bands were selected based on the size of the proteolytic fragments observed by WB (f) and subjected to proteolytic digestion followed by LC-MS/MS analysis. Proteomic analysis revealed that aSyn fragments generated in KO neurons transduced with PFF originate from C-terminal truncation, rather than N-terminal cleavage, of the PFF seeds. The diagram in (i) shows the different aSyn fragments generated upon C-terminal truncation and their relative position in a WB. Three fragments (1–135, 1–129, and 1–119) were detected in the upper band, and one main fragment (1–114) was found in the lower band. Original uncropped and unprocessed WB scans are provided in Supplementary Fig. 17. In (h–i), multiplexed detection (LiCor technology) allowed simultaneous antibody probing and multiple detections from the same membrane; thus, some immunoblots share the same actin control. See Supplementary Fig. 17 for a detailed explanation.
Fig. 2
Fig. 2. aSyn PFF seeds are predominantly internalized via the endo-lysosomal route and are processed both in the endolysosomes and the cytosol of the neurons.
a, b aSyn KO neurons were treated for up to 72 h with WT fluorescently labeled PFF488. The internalization and the truncation of the seeds were evaluated by confocal imaging. a One hour after addition to the KO neurons, we observed that most of the intracellular PFF488 were co-stained by an antibody raised against the extremity of aSyn C-terminal domain (epitope: 134–138, yellow arrows). C-terminal truncation of the seeds over time was confirmed by the loss of detection of the seeds by the C-terminal aSyn antibody (134–138, red; green arrows). b The internalization of the seeds via the endo-lysosomal pathway was confirmed by the detection of the fluorescently labeled PFF488 seeds in LAMP1-positive (late endosome, red) compartments over time. a, b Neurons were counterstained with MAP2 antibody, and the nucleus with DAPI stain. Scale bars = 10 μm. c Cathepsin B activity was measured in KO neurons treated with 70 nM of WT PFF seeds for up to 48 h. Control neurons were treated with Tris buffer. The graphs represent the mean ± SD of 3 independent experiments. The level of Cathepsin B activity is expressed as a fold change relative to Tris. **p < 0.001, ***p < 0.0001 (ANOVA followed by Tukey HSD post hoc test, Tris vs. PFF-treated neurons). d Truncation of aSyn PFF in the cytosol is confirmed by microinjection. The diagram on the left-hand side shows the experimental approach used to microinject WT PFF488 in KO neurons. Cells were fixed after 24 h and immunostained using the N-terminus antibody (aSyn 1–20) or C-terminus antibody (aSyn 134–138). Confocal imaging showed that WT PFF488 were detected by the N-terminus antibody (yellow arrows, merge), but not the C-terminus antibody (green arrows, merge). Neurons were counterstained with MAP2 antibody, and the nucleus with DAPI stain. Scale bars = 40 μm.
Fig. 3
Fig. 3. C-terminal truncation is a general phenomenon in aSyn seeding and inclusion formation in cells.
WB analyses of the truncation pattern of aSyn in primary neurons (a, b), in vivo after injection of human PFF in the striatum of WT and aSyn KO mice (c), in iPSC-derived neurons from a healthy control individual transduced with human PFF (d). Hippocampal (HIPP) and cortical (CTX) primary neurons from mice or (a) hippocampal (HIPP), cortical (CTX), or striatal (STR) primary neurons from rats (b) were treated for 10 days with 70 nM of mouse PFF. iPSC-derived neurons were treated with 70 nM of human PFF for 1, 3, 7, 10, and 14 days (d). Control neurons were treated with Tris buffer (−). The striatum of WT or aSyn KO mice was dissected after 1 h or 1, 3, or 7 days after injection with human PFFWT (c). Cell lysates were analyzed by immunoblotting after sequential extractions of the soluble and insoluble fractions. The levels of total aSyn (SYN-1, 4B12, or 134–138 antibodies) (15 kDa, indicated by a double red asterisk; 12 kDa indicated by a single red asterisk or HMW) were estimated by measuring the WB band intensity and normalized to the relative protein levels of actin (Supplementary Fig. 9). Purple arrows indicate the intermediate aSyn-truncated fragments. All the original uncropped and unprocessed WB scans are available in Supplementary Fig. 17.
Fig. 4
Fig. 4. Preventing aSyn cleavage at 114 does not impact the seeding capacity of PFF in primary neurons.
aSyn KO neurons were treated for 14 h (a) or up to 21 days (b), or aSyn WT neurons were treated for 10 days (c) with PFFWT, PFFE114A, PFFD115A, or with PFF1–114. Neurons were lysed at the indicated time, and the insoluble fractions were analyzed by WB. The total aSyn (SYN-1 antibody) levels were estimated by measuring the WB band intensity normalized to the relative protein levels of actin. A double red asterisk indicates the 15 kDa species (full-length), and a single red asterisk indicates the C-terminal truncated species running at 12 kDa. The purple arrows indicate the intermediate aSyn-truncated fragments. de Newly formed inclusions were detected using pS129 antibody (81a) in WT neurons after 10 days of treatment. Neurons were counterstained with MAP2 antibody, and the nucleus was counterstained with DAPI staining. d Representative confocal images. Scale bar = 5 μm. e Quantification of images acquired by a high-throughput wide-field cell imaging system. For each independent experiment, triplicate wells were acquired per condition, and nine fields of view were imaged for each well. Each experiment was reproduced at least 3 times independently. Images were then analyzed using Cell profile software to identify and quantify the level of LB-like inclusions (stained with pS129 antibody, 81a clone) formed in neurons (MAP2-positive cells). The graphs (a, c, e) represent the mean ± SD of three independent experiments. a, c aSyn species were quantified by densitometry, normalized to actin levels, and expressed as fold change relative to PFFWT-treated neurons. e pS129 level was expressed as fold change relative to PFFWT-treated neurons. a, c, e *p < 0.01, **p < 0.001, ***p < 0.0001 (ANOVA followed by Tukey HSD post hoc test, Tris vs. PFF-treated neurons). ##p < 0.005 (ANOVA followed by Tukey HSD post hoc test, PFFWT vs. mutants PFF-treated neurons). All the original uncropped and unprocessed WB scans are available in Supplementary Fig. 17.
Fig. 5
Fig. 5. The newly formed aSyn fibrils are processed differently and undergo more complex PTMs compared to exogenous PFF.
Identification of C-terminal truncated fragments by proteomic analysis (a, b), WB (c and Fig. 1h, i), or confocal imaging (dg). WT neurons were treated with 70 nM of mouse PFF for 10 days. a, b The insoluble fractions of PFF-treated neurons were separated on a 16% Tricine gel. After Coomassie staining, 8 bands were extracted from the Tricine gel (a). Isolated bands were subjected to proteolytic digestion using trypsin for C-terminal truncation identification, followed by LC-MS/MS analysis. b Proteomic analyses showed the presence of the 1–114 and 1–119 C-terminal truncated fragments in the HMW species. c Table summarizing the capacity of NAC domain, N-terminal, and C-terminal antibodies to detect full-length aSyn (15 kDa), the C-terminally cleaved fragment of aSyn (~12 kDa), and the HMW formed in WT neurons after 10 days of treatment with PFF (see WB in Fig. 1h, i). Antibody mapping of the newly formed inclusions by confocal imaging using pS129 antibody (81a clone) in combination with N-terminal (d, epitope 1–20) or C-terminal (eg, respective epitopes 108–120, 116–131, or 134–138) antibodies revealed the presence of aSyn-positive aggregates that were not pS129 positive or only partially phosphorylated at S129 residue (e, f). Neurons were counterstained with MAP2 antibody, and the nucleus with DAPI stain. The white arrows indicate the sub-populations of aggregates localized near the pS129-positive inclusions, and the white asterisk those inside the pS129-positive filamentous structures. Scale bars = 10 μm.
Fig. 6
Fig. 6. Newly formed fibrils undergo lateral association and fragmentation over time.
PFF were added for 10 (a), 14 (b), and 21 (ce) days to the extracellular media of hippocampal neurons plated on dishes with alpha-numerical searching grids imprinted on the bottom, which allowed the localization of the cells. At the indicated time, neurons were fixed and imaged by confocal microscopy (top images), and the selected neurons were embedded and cut by an ultramicrotome. Serial sections were examined by EM. Representative newly formed aSyn fibrils are indicated with a red arrow. Autophagolysosomal-like vesicles are indicated by a yellow asterisk, and the mitochondrial compartments by a green asterisk. The nucleus is highlighted in blue. a, b Scale bars = 500 nm; c, d Scale bars = 1 μm; e Scale bar = 2 μm.
Fig. 7
Fig. 7. C-terminal truncation promotes the lateral association of aSyn PFF in vitro.
a aSyn protein structure. The acidic C-terminal domain (purple, residues: 96–140) is negatively charged (z = −12), while the N-terminal domain (green, residues: 1–60) together with the central hydrophobic core named NAC (red, residues: 61–95) are positively charged. Interaction of unfolded aSyn monomers leads to the formation of (1) dimers that grow into (2) oligomers and protofibrils, which convert to (3) fibrils. During fibrilization, the C-terminal domain is exposed on the surface. b Full-length recombinant aSyn, C-terminal truncated aSyn (1–135, 1–133, 1–124, 1–120, 1–115 or 1–111), and aSyn with single (Δ111–115, Δ120–125 or Δ133–135) and double deletions (Δ111–115Δ133–135) were incubated at 37 °C for 6 days under shaking conditions and imaged by EM. We observed that the removal of charges in the C-terminal truncated proteins induces lateral association of the PFF, resulting in highly packed fibrils. The level of lateral association is stronger for the proteins with a lower number of negative charges in their C-termini. The number of C-terminal charges is indicated on the right side of each diagram. Scale bar = 200 nm. The lateral association is not observed for the PFF1–135, for which the number of negative charges remains comparable to that of the WT protein. Likewise, PFF with single (Δ111–115, Δ120–125 or Δ133–135) and double deletions (Δ111–115Δ133–135) do not laterally associate, as the number of negative charges remains comparable to that of the WT protein. Scale bars = 100 nm or 200 nm. c Fibrils formation was induced by incubating C-terminally truncated aSyn 1–114 at 37 °C and pH 10.5 in 50 mM Tris and 150 mM NaCl under constant agitation at 1000 rpm on an orbital shaker. After 6 days, PFF were sonicated, and the pH was re-adjusted to 7.5. After 2 h at room temperature, PFF laterally associated and formed large, dense aggregate clumps. Scale bars = 500 nm. Semisynthesis (d) and strategy (e) of photocleavable aSyn at position 120. fi Photolysis of aSyn monomers (f) and PFF (g) results in the rapid generation of C-terminally truncated aSyn. h EM confirmed that photolysis of photocleavable aSyn PFF enabled the lateral association and clumping of the PFF, as also depicted in the diagram in (i). Scale bar = 200 nm.
Fig. 8
Fig. 8. The formation and maturation of the LB-like inclusions induce the activation and the sequestration of calpain 1 and 2.
Calpains 1 and 2 are activated in the soluble (b) and insoluble fractions (c) but not in the extracellular media (a) of PFF-treated WT neurons or control neurons (Tris). Activity levels of calpains 1 and 2 were assessed at the indicated times. The graphs represent the mean ± SD of 3 independent experiments. p < 0.001 = **, p < 0.0001 = *** (ANOVA followed by Tukey HSD post hoc test, Tris vs. PFF-treated neurons). df Calcium homeostasis is affected in the PFF-treated neurons. Intracellular calcium levels were measured in Tris- or PFF-treated neurons at early time points (d, 1 h, 3 h, 6 h, 8 h) or at late time points (e, D1, D2, D7, D14, D21) after the addition of the seeds to the neurons. The Fura-2 340/380 ratio was measured in each condition. Each dot represents one neuron subjected to Fura-2 calcium imaging. The data are represented mean ± SD, *p < 0.05, **p < 0.005, ***p < 0.0005 (ANOVA followed by Tukey HSD post hoc test). f Temporal transcriptomic analysis of the gene expression level in PFF-treated neurons (accession no. GSE142416) available in the Gene Expression Omnibus (GEO) database. Differentially expressed genes were plotted against −log10 P value (t-test, PBS-treated neurons vs. PFF-treated neurons). Log2 fold changes of the calcium gene expression levels are represented over time. “+” and “−” indicate a significant upregulation or downregulation in the gene expression level. g Confocal imaging confirmed the recruitment of calpains 1 and 2 inside the LB-like inclusions, positively stained for pS129-aSyn. Neurons were counterstained with MAP2 antibody, and the nucleus with DAPI staining. Scale bar = 10 μm. h Temporal proteomic analyses showing the enrichment of calpain 2 protein in the insoluble fraction of PFF-treated WT neurons. Transcriptional regulation of calpain 1 (i) and calpain 2 (j) in WT neurons was treated with PFF for up to 21 days. Quantitative RT-qPCR was performed with primers specific for calpain 1 (i) and calpain 2 (j) at the indicated time points after adding PFF to WT neurons. Results are presented as fold increases in comparison to the respective level in control neurons treated with Tris buffer. mRNA levels were normalized to the relative transcriptional levels of GAPDH and actin housekeeping genes. The graphs represent the mean ± SD of three independent experiments. *p < 0.05 (ANOVA followed by Tukey HSD post hoc test, Tris vs. PFF-treated neurons).
Fig. 9
Fig. 9. Calpain 1 is involved in the truncation of aSyn in primary neurons.
a Experimental design to study the role of calpain 1 in the maturation of the newly formed fibrils. DMSO or calpain inhibitor I was added to PFF-treated neurons at D7. bd Level and morphology of the pS129-positive inclusions formed in PFF-treated WT neurons in the presence of DMSO or calpain inhibitor I were assessed after immunostaining using pS129 (81a) antibody in combination with total aSyn N-terminal (1–20) or C-terminal (134–138) antibodies. Neurons were counterstained with MAP2 antibody, and the nucleus with DAPI staining. Each experiment was reproduced at least 3 times independently. b Representative images by confocal imaging. Scale bars = 5 μm. c Newly formed aggregates were classified into two groups based on their shapes: long filamentous inclusions (b, top panel) or small and rounded inclusions (b, bottom panel). A minimum of 60 neurons was counted for each condition. d Quantification of images acquired by a high-throughput wide-field cell imaging system. For each independent experiment, duplicated wells were acquired per condition, and nine fields of view were imaged for each well. Each experiment was reproduced at least 3 times independently. Images were then analyzed using the CellProfiler software to identify and quantify the level of LB-like inclusions (stained with pS129 antibody, 81a clone) formed in neurons (MAP2-positive cells). e WB analyses of the insoluble fraction of Tris- or PFF-treated WT neurons treated with DMSO or calpain inhibitor I between day 7 and day 10. After sequential extractions of the soluble and insoluble fractions, cell lysates were analyzed by immunoblotting. Total aSyn, pS129, and actin were detected by SYN-1, pS129 (MJF-R13), and actin antibodies, respectively. WB band intensities of total aSyn (15 kDa, 12 kDa, and HMW species) and pS129-aSyn were quantified by densitometry, normalized to actin levels, and expressed as fold change relative to PFF + DMSO-treated primary neurons. f Cell death level was assessed over time based on lactate dehydrogenase (LDH) release. ce, f The graphs represent the mean ± SD of 3 independent experiments. *p < 0.05, **p < 0.005, ***p < 0.0005 (ANOVA followed by Tukey HSD post hoc test, DMSO-Tris-treated neurons vs. the other conditions). #p < 0.05, ##p < 0.005, ###p < 0.0005 (ANOVA followed by Tukey HSD post hoc test, DMSO-PFF-treated neurons vs. Calpain inhibitor I-PFF-treated neurons). All the original uncropped and unprocessed WB scans are available in Supplementary Fig. 17.
Fig. 10
Fig. 10. A set of aSyn antibodies captures the morphological spectrum of aSyn pathology in synucleinopathy brain tissues.
a WB analyses of the truncation pattern of aSyn in human brain tissue from MSA patients and healthy controls. Cell lysates were analyzed by immunoblotting after sequential extractions of the soluble and insoluble fractions. aSyn species were detected using 1–20, SYN-1, or 134–138 or pS129 antibodies. A double red asterisk indicates the 15 kDa band, the 12 kDa band by a single red asterisk, and the purple arrows indicate the intermediate aSyn-truncated fragments. WB band intensities of total aSyn (15 and 12 kDa) were quantified in the insoluble fraction by densitometry and normalized to actin levels. The level of the 15 kDa aSyn species in the insoluble fraction of the MSA patients is expressed as fold change relative to healthy controls. a.u (arbitrary units). b, c Serial sections from the midbrains of PDD (pars compacta) and SNCA duplication (tegmentum) cases were stained with aSyn antibodies raised specifically against the N-terminal (epitope: 1–20), the NAC (91–99), the C-terminal (epitopes: 110–115 and 134–138) or pS129 (EP1536Y) regions. Scale bars = 50 μm. All the original uncropped and unprocessed WB scans are available in Supplementary Fig. 17.

References

    1. Goedert, M., Jakes, R. & Spillantini, M. G. The synucleinopathies: twenty years on. J. Parkinsons Dis.7, S53–S71 (2017). - PMC - PubMed
    1. Anderson, J. P. et al. Phosphorylation of Ser-129 is the dominant pathological modification of alpha-synuclein in familial and sporadic Lewy body disease. J. Biol. Chem.281, 29739–29752 (2006). - PubMed
    1. Fujiwara, H. et al. alpha-Synuclein is phosphorylated in synucleinopathy lesions. Nat. Cell Biol.4, 160–164 (2002). - PubMed
    1. Baba, M. et al. Aggregation of alpha-synuclein in Lewy bodies of sporadic Parkinson’s disease and dementia with Lewy bodies. Am. J. Pathol.152, 879–884 (1998). - PMC - PubMed
    1. Crowther, R. A., Jakes, R., Spillantini, M. G. & Goedert, M. Synthetic filaments assembled from C-terminally truncated alpha-synuclein. FEBS Lett.436, 309–312 (1998). - PubMed

LinkOut - more resources