. 2025 Aug 26;16(1):7939.
doi: 10.1038/s41467-025-63398-y.

Non-equilibrium critical scaling and universality in a quantum simulator

Affiliations

Non-equilibrium critical scaling and universality in a quantum simulator

Arinjoy De et al. Nat Commun. .

Abstract

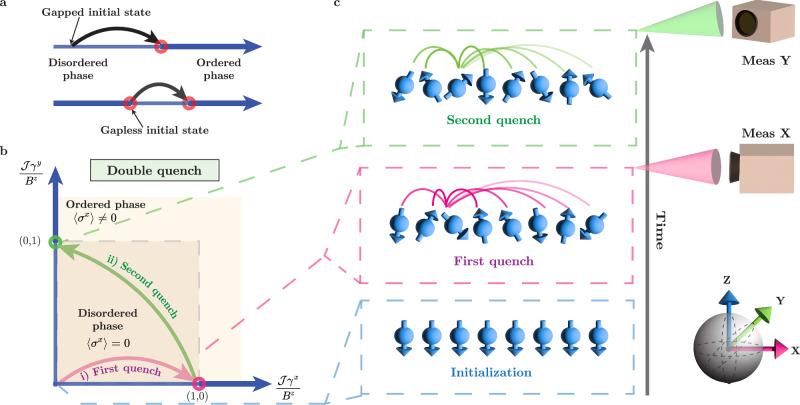
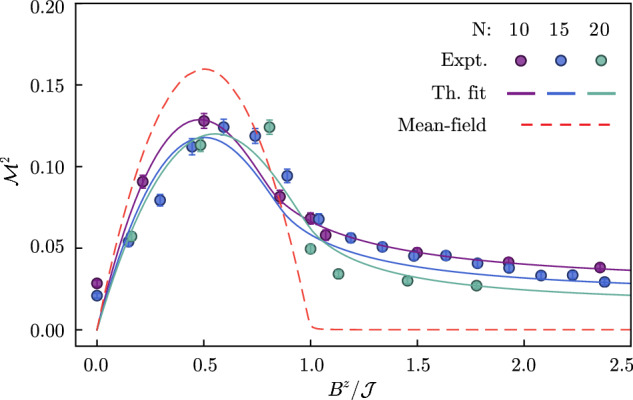
Universality and scaling laws are hallmarks of equilibrium phase transitions and critical phenomena. However, extending these concepts to non-equilibrium systems is an outstanding challenge. Despite recent progress in the study of dynamical phases, the universality classes and scaling laws for non-equilibrium phenomena are far less understood than those in equilibrium. In this work, using a trapped-ion quantum simulator with single-spin resolution, we investigate the non-equilibrium nature of critical fluctuations following a quantum quench to the critical point. We probe the scaling of spin fluctuations after a series of quenches to the critical Hamiltonian of a long-range Ising model. With systems of up to 50 spins, we show that the amplitude and timescale of the post-quench fluctuations scale with system size with distinct universal critical exponents, depending on the quench protocol. While a generic quench can lead to thermal critical behavior, we find that a second quench from one critical state to another (i.e. a double quench) results in a new universal non-equilibrium behavior, identified by a set of critical exponents distinct from their equilibrium counterparts. Our results demonstrate the ability of quantum simulators to explore universal scaling beyond equilibrium.


Conflict of interest statement

Competing interests: The authors declare no competing interests.

Figures

Fig. 1
Fig. 1. Critical quench dynamics.
a Disorder-to-order phase transitions emerge even in the non-equilibrium setting of quench dynamics, and exhibit critical behavior at the transition. The ordered and disordered phases are shown in thick and thin lines, respectively, and the arrows indicate a quench to the critical point. While a quench from a gapped initial state (top panel) to the critical point (red circles) generically leads to effective thermal behavior, a quench from a gapless state (bottom panel), corresponding to a distinct critical point, gives rise to non-equilibrium criticality. b Ground-state phase diagram with Ising interaction along x or y direction. Jγx,y/Bz is the ratio of the Kac-normalized effective interaction strength Jγx,y to the transverse field strength Bz (see text). The phase boundary is shown in gray dashed lines, with red and green circles indicating the critical points where the quenches are performed. c The experimental sequence starting with all spins initialized along z. The first quench is applied with interactions along the x direction, and the evolution is measured by projecting the spins along x. For the second quench, both the interaction and measurement bases are switched from x to y direction. In the double-quench experiment, the second quench is applied after evolving under the first quench, but no measurement is performed before the second quench. The curved lines illustrate the long-range interaction among all the spins where the opacity reflects interaction strengths that weaken with distance.
Fig. 2
Fig. 2. Phase transition from order parameter.
We report scaled maximum net correlator M2=maxt[Cx2/N2] as a function of Bz/J for system sizes N = 10, 15, 20. The solid lines are obtained by fitting the experimental data to the finite size corrected order parameter (Eq. (28) of SI), which has the critical point as a fit parameter. The extracted values are 0.83 (19), 0.88 (6), 1.01 (9), respectively for N = 10, 15, 20; the difference from the predicted critical point Bz/J=1 is due to finite-size effects and experimental imperfections. For simplicity, we use the predicted critical value for studies in Figs. 3, 4. The dashed line represents the mean-field solution with an inflection point at Bz/J=1. For the comparison of the experimental data against decoherence-free numerical simulation, see Supplementary Fig. 2. The error bars are statistical fluctuations around the mean value.
Fig. 3
Fig. 3. Unscaled (a) and scaled (b) fluctuations after a single quench.
a We report experimental critical fluctuations with system sizes up to N = 50 ions. We obtain the critical scaling exponents (α1ζ1) by optimizing the weighted Euclidean distance between each of the curves to get the best collapse for the experimental (b) data [see main text for details]. We observe remarkable similarity between the exponents found in the experiment and simulations (see Supplementary Fig. 3), highlighting the universality of the exponents despite experimental imperfections as well as finite-size effects. Comparing the decoherence-free numerical simulation in Supplementary Fig. 3 with the experimental data, we note that the fluctuations in the experiment are reduced due to decoherence and imperfect detection fidelity; however, as we can see from the scaled data, the scaling collapse is still observed for all the system sizes. In the inset b, we find consistent scaling exponents by fitting the maximum values of the fluctuation (dots) to a power-law fit to Nα1 (solid lines). Although this method does not capture the full evolution, we get excellent agreement of exponents for both the simulation and the experiment. The data points from numerical simulation (in green) do not account for decoherence, resulting in higher peak values as compared to the experimental values (see Supplementary Fig. 3). In Supplementary Fig. 3b, we present numerical simulations of critical dynamics for N = 10 and 15, incorporating decoherence effects. The error bars of the experimental data are statistical fluctuations around the mean value.
Fig. 4
Fig. 4. Unscaled (a) and scaled (b) fluctuations after a double quench.
a We plot the unscaled fluctuations along y direction at the predicted critical points for system sizes of N = 10--50 ions. The second quench is applied when the fluctuations following the first quench reach their maxima and the time t2 is counted after the second quench. b We apply the same scaling collapse technique as for the single quench to find the best scaling exponents (α2ζ2) for the experimental data. See Supplementary Fig. 4 for numerical simulations of the data. We observe that the critical fluctuations do not monotonically grow for increasing system sizes, as would be expected from the scaling relations. This effect can be attributed to the imperfect switching time between the first and second quench; a nearly perfect collapse can be reproduced numerically using the precise switch times (SI Sec. VII.D). We also report exponents found by a power-law fit of the maximum fluctuations which agree more closely with the analytical prediction (Inset b.). While determining the experimental critical exponents, we have excluded 50 ion data (gray) [see main text for details]. The error bars of the experimental data are statistical fluctuation around the mean value.

References

    1. Heyl, M., Polkovnikov, A. & Kehrein, S. Dynamical quantum phase transitions in the transverse-field Ising model. Phys. Rev. Lett.110, 135704 (2013). - PubMed
    1. Heyl, M. Dynamical quantum phase transitions: a brief survey. EPL125, 26601 (2019).
    1. Marino, J., Eckstein, M., Foster, M. M. & Rey, A.M. Dynamical phase transitions in the collisionless pre-thermal states of isolated quantum systems: theory and experiments. Rep. Progress Phys.85, 116001 (2022). - PubMed
    1. Li, B. W. et al. Probing critical behavior of long-range transverse-field Ising model through quantum Kibble-Zurek mechanism. arXiv:2208.03060, (2022).
    1. Jurcevic, P. et al. Direct observation of dynamical quantum phase transitions in an interacting many-body system. Phys. Rev. Lett.119, 080501 (2017). - PubMed

LinkOut - more resources