. 2025 Aug 26;10(1):60.
doi: 10.1038/s41525-025-00521-4.

Genome sequencing provides high diagnostic yield and new etiological insights for intellectual disability and developmental delay

Kohei Hamanaka #  1 Atsushi Fujita #  1 Satoko Miyatake #  1   2   3 Kazuharu Misawa #  1 Eriko Koshimizu #  1 Yuri Uchiyama #  1   4 Naomi Tsuchida  1   4 Rie Seyama  1   5 Masamune Sakamoto  1   4   6 Kazuhiro Iwama  1   6 Naoto Nishimura  1 Yasuhiro Utsuno  1   7 Li Fu  1   5 Marina Takizawa  1 Qiaowei Liang  1 Toshiyuki Itai  1 Ken Saida  1 Sachiko Ohori  1 Shinichi Kameyama  1 Hiromi Fukuda  1   8 Yukina Hayashi  1 Yuta Inoue  1 Tomohide Goto  9 Kazushi Ichikawa  9 Ichiro Kuki  10 Masataka Fukuoka  10 Kiyohiro Kim  10   11 Tadashi Shiohama  12 Konomi Shimoda  13 Kosuke Otsuka  14 Yuki Ueda  15 Kazutoshi Cho  16 Kotaro Yuge  17 Nobutada Tachi  18   19 Masaki Yoshida  19 Atsuro Daida  20 Kyoko Hirasawa  21 Tomoe Yanagishita  21 Toshiyuki Yamamoto  22 Kentaro Shirai  23 Tammar Fixler Mehr  24 Aviva Fattal-Valevski  25   26   27 Dorit Lev  28   29 Haruna Yokoyama  30 Emi Iwabuchi  30 Yoshihiko Saito  30 Masaki Miura  30 Kenji Sugai  30 Akihiko Ishiyama  30 Masayuki Sasaki  30 Yoshihiro Watanabe  31 Jun-Ichi Takanashi  32 Chong Ae Kim  33 Kenji Yokochi  34   35 Jun Tohyama  36 Tatsuo Mori  37 Yuishin Izumi  38 Yuiko Hasegawa  39 Nobuhiko Okamoto  39 Takahiro Ikeda  40 Hitoshi Osaka  40 Yosuke Kawai  41 Yosuke Omae  41 Katsushi Tokunaga  41 Mitsuhiro Kato  42 Takeshi Mizuguchi  1 Naomichi Matsumoto  43   44   45
Affiliations

Genome sequencing provides high diagnostic yield and new etiological insights for intellectual disability and developmental delay

Kohei Hamanaka et al. NPJ Genom Med. .

Abstract

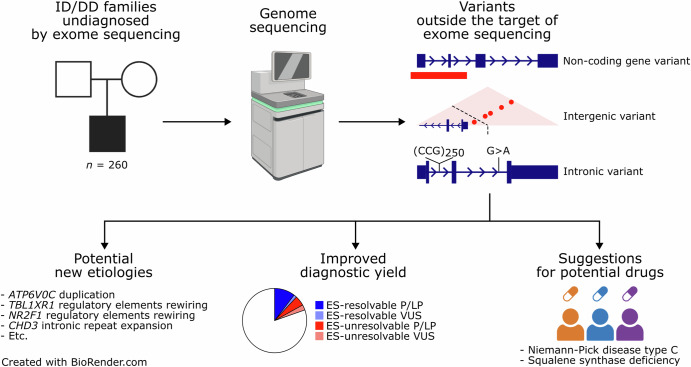
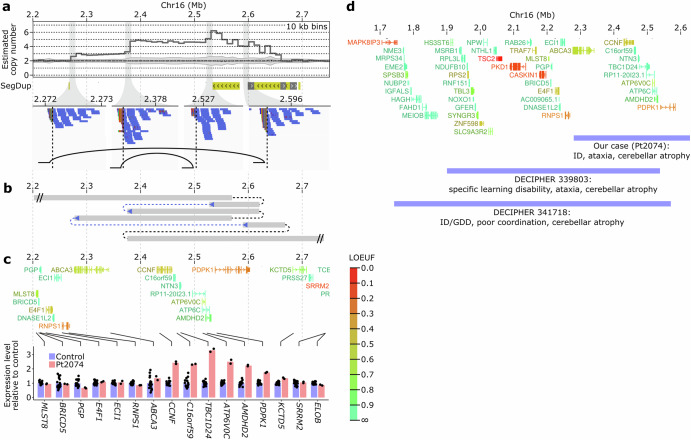
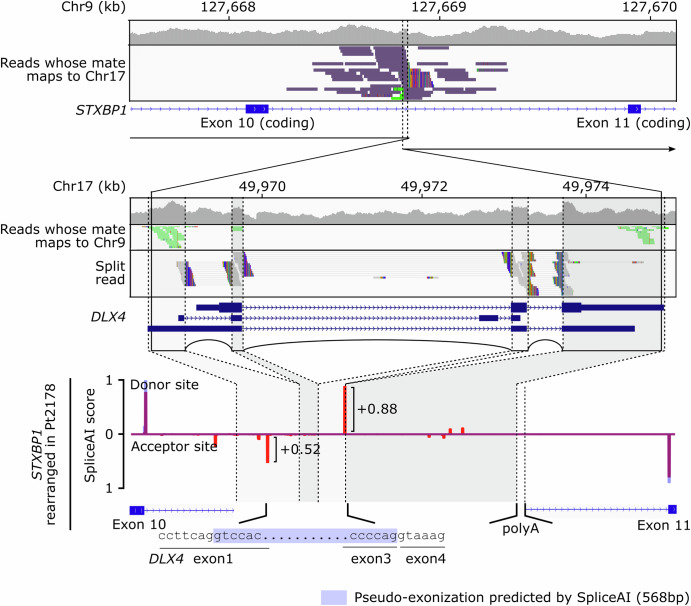
Short-read genome sequencing (GS) is a powerful technique for investigating the genetic etiologies of rare diseases, capturing diverse genetic variations that are challenging to approach with exome sequencing (ES). We performed GS on 260 families with intellectual disability/developmental delay. GS detected potentially disease-related variants in 55 of the 260 families, with structural resolution by long-read sequencing or optical genome mapping, and functional assessment by RNA sequencing. Excluding 31 theoretically ES-resolvable cases, GS yielded likely pathogenic variants in 17 of 229 as well as variants of unknown significance in 7 of 229, totaling 10.5%. These variants implicated several new etiological mechanisms: a microduplication syndrome involving ATP6V0C; disturbed interactions of TBL1XR1 and NR2F1 with putative cis-regulatory elements by chromosomal rearrangements; and a CCG repeat expansion near the CHD3 transcription start site. This study highlights the critical role of GS in clinical diagnostics and its potential to advance understanding of genetic disorders.


Conflict of interest statement

Competing interests: The authors declare no competing interests.

Figures

Fig. 1
Fig. 1. Overview of this study.
This figure was created in BioRender. Hamanaka, K. (2025) https://BioRender.com/f32v286.
Fig. 2
Fig. 2. De novo variants in non-coding genes RNU4-2 and CHASERR.
a De novo small variants in the critical region of RNU4-2 in Pt0712 and Pt2092. Lollipop plot: Pathogenic/Likely pathogenic variants in ClinVar (https://ftp.ncbi.nlm.nih.gov/pub/clinvar/vcf_GRCh38/clinvar_20250608.vcf.gz). Green rectangle: RNA secondary structure. Heatmap plot: aggregated allele counts of single-nucleotide variants at each genomic position, derived from gnomAD v4.1.0 (https://gnomad.broadinstitute.org/data). b De novo deletion affecting CHASERR in Pt2190. Shown is an IGV view of read coverage and reads supporting the deletion. Read coloring follows the conventions of IGV for paired-end alignments (https://igv.org/doc/desktop/#UserGuide/tracks/alignments/paired_end_alignments).
Fig. 3
Fig. 3. De novo high-copy-number amplification of ATP6V0C.
A de novo 16p13.3 multiplication in Pt2074. a Upper, copy number profiles estimated using CNView. Lower, adjoined breakends identified through GS are illustrated as curved lines in the IGV snapshots. SegDup is displayed as in the UCSC genome browser (https://genome.ucsc.edu/cgi-bin/hgTrackUi?g=genomicSuperDups). The copy number profiles are presented in bins indicated on the top right corner, with gray intervals representing the mean ± two standard deviations of 1330 samples. Read colors follow IGV conventions. b The overall structure estimated from optical genome mapping data. Breakpoints, inferred from optical genome mapping data, are colored black. c Bar plot of gene expression levels in RNA-seq of Pt2074’s LCL (replicate n = 2) relative to control samples (n = 17). Individual replicates and control samples are indicated by black dots over the red and blue bars, respectively. d Two DECIPHER cases with similar 16p13.3 duplications to Pt2074. Blue bar: duplication; black bar: multiplication in Pt2074. c, d Gene models are taken from the gnomAD constraint metrics track of the UCSC genome browser (https://genome.ucsc.edu/cgi-bin/hgTrackUi?db=hg19&g=gnomadPLI) and color-coded according to LOEUF.
Fig. 4
Fig. 4. De novo intergenic SVs disturbing interactions of TBL1XR1 and NR2F1 with putative cis-regulatory elements.
Chromatin landscape around TBL1XR1 (a) and NR2F1 (c). From top to bottom, the figure displays the contact map and chromatin loop calls of an HFFc6 micro-C, coverage tracks of ATAC-seq and histone ChIP-seq including H3K27ac, H3K4me3, and H3K4me1 modifications in BE(2)-C and SH-SY5Y, and GENCODE V44 gene models colored according to UCSC conventions (https://genome.ucsc.edu/cgi-bin/hgTrackUi?hgsid=2280748172_eutv8PURT0qZPmMVtttVc16EEnGI&c=chr12&g=wgEncodeGencodeV44). Dotted lines indicate SV breakpoints observed in Pt2286 (a) and Pt2800 as well as in a previous study (c). b, d Enlarged views of the (a) and (c) panels. The top tracks depict the regions interacting with the TBL1XR1 TSS (b) or NR2F1 TSS (d). To the left of the coverage tracks are the depth-normalized coverage intervals on the Y-axis.
Fig. 5
Fig. 5. De novo DLX4 retrotransposition possibly altering splicing in STXBP1 deep intronic region.
A de novo retrotransposition of a DLX4 transcript into STXBP1 intron 10 in Pt2178. Depicted are IGV snapshots of STXBP1 (top) and DLX4 (middle) alongside GENCODE transcript models, and SpliceAI score distribution along the mutant STXBP1 intron 10 sequence in Pt2178 (bottom). For the SpliceAI score, the upper portion illustrates donor site scores while the lower portion displays acceptor site scores. Blue bars: wild-type sequence scores; red bars: mutant sequence scores; blue rectangle: potential pseudo-exonization based on SpliceAI predictions.
Fig. 6
Fig. 6. De novo intronic CCG repeat expansion near the CHD3 TSS.
a Counts of in-CCG-repeat reads anchored to Chr17:7884501-7886140 in CHD3 among Pt481, his parents, and healthy control individuals. bd T-LRS of the Chr17:7,885,308-7,885,345 CCG repeat at CHD3 in Pt481 and his mother. b Frequency of CCG repeat size in T-LRS reads. Red, forward read; blue, reverse read. c Waterfall plot showing the tri- or di-nucleotide composition of the CCG repeat expansion and flanking sequences in T-LRS reads. Tri- or di-nucleotides were colored as shown in the upper right corner. d DNA methylation status around the predominant CHD3 TSS. Top, GENCODE transcript models; middle, total CAGE counts aggregated from various cells and tissues (https://genome.ucsc.edu/cgi-bin/hgTrackUi?db=hg38&g=fantom5); bottom, T-LRS reads with (“exp.”) or without (“no-exp.”) CCG repeat expansion. Horizontal line: T-LRS read; black circle: methylated CpG; white circle: unmethylated CpG.

References

    1. Smedley, D. et al. 100,000 genomes pilot on rare-disease diagnosis in health care - preliminary report. N. Engl. J. Med.385, 1868–1880 (2021). - PMC - PubMed
    1. van der Sanden, B. et al. The performance of genome sequencing as a first-tier test for neurodevelopmental disorders. Eur. J. Hum. Genet.31, 81–88 (2023). - PMC - PubMed
    1. Lindstrand, A. et al. Genome sequencing is a sensitive first-line test to diagnose individuals with intellectual disability. Genet. Med.24, 2296–2307 (2022). - PubMed
    1. Bertoli-Avella, A. M. et al. Successful application of genome sequencing in a diagnostic setting: 1007 index cases from a clinically heterogeneous cohort. Eur. J. Hum. Genet.29, 141–153 (2021). - PMC - PubMed
    1. Stranneheim, H. et al. Integration of whole genome sequencing into a healthcare setting: high diagnostic rates across multiple clinical entities in 3219 rare disease patients. Genome Med.13, 40 (2021). - PMC - PubMed