. 2025 Aug 26;15(1):31431.
doi: 10.1038/s41598-025-15637-x.

Spectral phasor imaging on a commercial confocal microscope without a spectral detector

Affiliations

Spectral phasor imaging on a commercial confocal microscope without a spectral detector

Elisa Longo et al. Sci Rep. .

Abstract

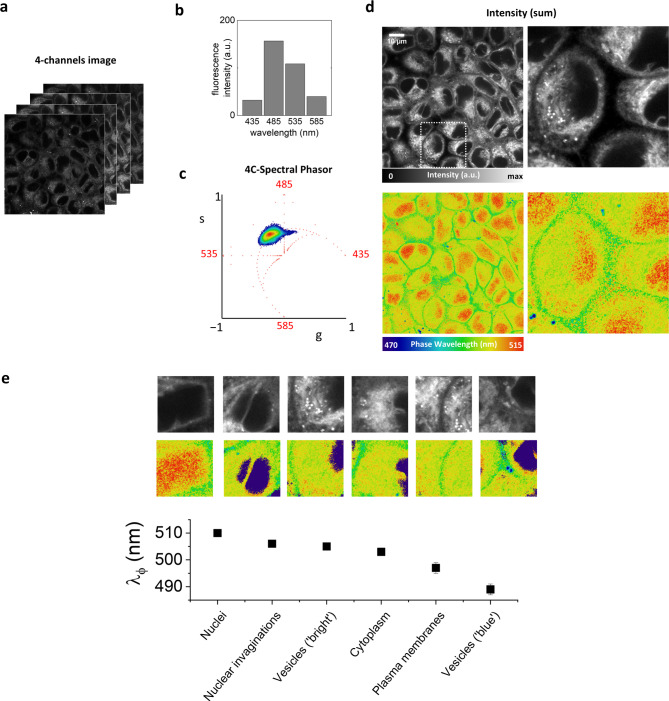
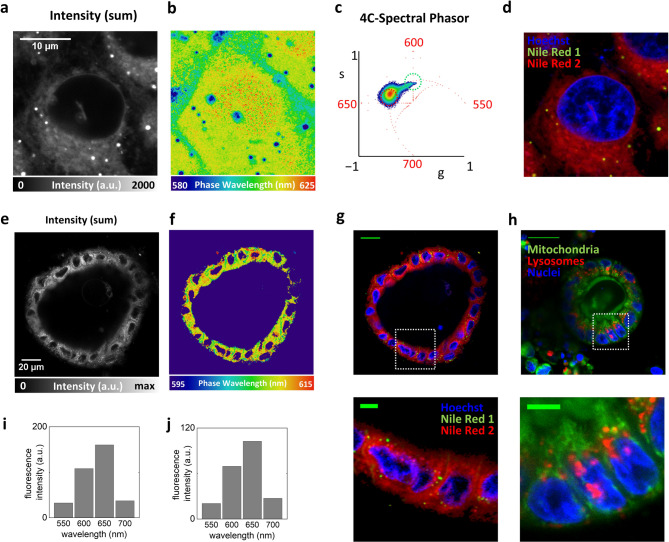
Spectral imaging is a fluorescence microscopy technique with several applications, including imaging of environment-sensitive probes, spectral unmixing and identification of fluorescent species. In confocal microscopes not equipped with a spectral detection unit, spectral images can be obtained using the lambda scan mode of the microscope, namely the sequential acquisition of images using a tunable emission filter or other dispersive optical elements. Unfortunately, the lambda scan mode has poor temporal resolution, is a photon-wasting technique, and is not ideal for the spectral imaging of live samples. Here, we describe a spectral imaging method that can be implemented on commercial confocal microscopes not equipped with a spectral detector. The method is based on simultaneous image acquisition in 4 contiguous spectral channels and spectral phasor analysis. We demonstrate that this method can be easily implemented on a Leica confocal laser scanning microscope, with better photon efficiency and temporal resolution than the lambda scan mode. We perform a 4-channel (4 C) spectral phasor analysis of live cells stained with the environment-sensitive ACDAN and Nile Red dyes. We can distinguish changes in spectral emission in the order of 5 nm between different subcellular compartments. We show that 4 C-spectral phasor can be used to decompose the Nile Red signal into 2 components and perform 3-color imaging in combination with a DNA dye in live organoids. Finally, we show that the 4 C-spectral phasor can be also used to unmix the signal of fluorescent proteins with overlapping emission spectra such as mEmerald and EYFP.

Keywords: ACDAN; Confocal microscope; Environment-sensitive probes; Fluorescent proteins; Nile red; Spectral phasor.


Conflict of interest statement

Declarations. Competing interests: The authors declare no competing interests. Software availability: A user-friendly, stand-alone version of the 4 C-spectral phasor software generated in Matlab is available at https://github.com/llanzano/4CSpectralPhasor .

Figures

Fig. 1
Fig. 1
Spectral phasor using 4 channels of a commercial laser scanning microscope. (ad) Schematic of the 4 C-spectral phasor method: (a) 4-color images are acquired using a commercial laser scanning microscope; (b) Emission spectra variations are sampled across four spectral detection windows; (c) For each pixel, a phasor in the (g, s) plane is computed, where phasor position shifts reflect pixel-to-pixel emission spectra variations; (d) a phase wavelength image (formula image) is calculated converting the value of phase into a value of wavelength. (eg) Simulated data used for reference line generation. The spectral bandwidth of each detection channel is set to 50 nm. (e, top) Simulated Gaussian spectra with a narrow bandwidth (FWHM = 10 nm) and peak wavelength increasing from the value λ1 (indicated by the arrow) in steps of 5 nm. (e, middle) Phasor plot of the simulated spectra. The red values (λ1, λ2, λ3, λ4) represent the center wavelengths of the 4 detection windows. Each red dot corresponds to a single spectrum. The narrow spectra are not uniformly sampled by the spectral windows, producing the polygonal trajectory. (e, bottom) Plot showing the phase value of the phasor versus the simulated peak wavelength for the 4C- and for the full spectral phasor. (f, top) Simulated Gaussian spectra with a broader bandwidth (FWHM = 100 nm) and peak wavelength increasing from the value λ1 (indicated by the arrow) in steps of 5 nm. (f, middle) Phasor plot of the simulated spectra. Each red dot corresponds to a single spectrum. The broad spectra are more uniformly sampled, resulting in a curved trajectory, where each dot represents a 5 nm shift in peak wavelength. (f, bottom) Plot showing the phase value of the phasor versus the simulated peak wavelength for the 4C- and for the full spectral phasor. (g, top) Simulated Gaussian spectra of fixed center wavelengths (λ1, λ2, λ3, λ4) and bandwidths increasing from 0 to the value 400 nm in steps of 20 nm. (g, middle) Phasor plot of the simulated spectra. Each red dot corresponds to a single spectrum. These simulated spectra produce radial-like phasor trajectories.
Fig. 2
Fig. 2
4-channels spectral imaging of fluorophores in solution. (a) Representative spectral imaging data of ANS in a water solution containing BSA and (b) corresponding average fluorescence intensity in the 4 channels. (c) Representative spectral imaging data of Rhodamine 110 in water and (d) corresponding average fluorescence intensity in the 4 channels. (e) The phasor plot showing different angular position for ANS-BSA and R110. The red values (435, 485, 535, 585) represent the center wavelengths of the 4 detection windows in nm. Linear combinations of the two datasets (‘linear mixing’) result in phasors positioned along the straight line connecting the phasors of the pure species. (f) The precision of the phase wavelength value, determined as the standard deviation of λφ across all pixels in the image for the ANS-BSA sample, plotted as a function of photon counts in the channel with maximum intensity. The red dashed line is a fit of the data to the equation Y = A (Ncounts)B, which yields B = − 0.50 and A = 20 nm.
Fig. 3
Fig. 3
4C-spectral phasor imaging of ACDAN in live cells. (a) Representative 4-channels image of ACDAN in HeLa cell and (b) corresponding average fluorescence intensity in the 4 channels covering the range between 410 and 610 nm. (c) spectral phasor plot: the elongated phasor plot indicates the presence of multiple spectral signatures, corresponding to ACDAN emission in different cellular environments. (d) Intensity image obtained as the sum of the intensity in the 4 channels (top) and phase wavelength image (bottom). (e) Analysis of phase wavelength for different subcellular structures. Phase wavelengths values range from 490 to 510 nm. The analyzed subcellular regions are: nuclei, nuclear invaginations, vesicles identified for their bright intensity, cytoplasm, plasma membrane, vesicles identified as ‘blue’ in the phase wavelength image. Data represent mean ± s.d. of at least 10 different ROI.
Fig. 4
Fig. 4
4C-spectral phasor imaging of Nile Red in live cells and live intestinal organoids. (a) Intensity image of Nile Red in live HeLa cells. Scale bar 10 μm. (b) Phase wavelength image of Nile Red in live HeLa cells. (c) The elongated phasor plot reveals pixel-to-pixel spectral variations, distinguishing the internal membrane, the plasma membrane, and the nucleus as regions of increasing spectral redshift. (d) Spectral variations allow the decomposition of the fluorescence signal into two components: Nile Red 1, corresponding to the less relaxed spectral emission, and Nile Red 2, corresponding to the more relaxed spectral emission. Combined with Hoechst staining, this approach enables three-color imaging using only two dyes. (e) Intensity image of a live organoid labeled with Nile Red. Scale bar 20 μm. (f) Phase wavelength image of a live organoid labeled with Nile Red. (g) Decomposition of Nile Red in 2 components provides a 3-color image, with Hoechst in one channel, lipid vesicles in another channel and internal membranes in the other. Scale bar 20 μm. In the zoom-in, scale bar is 5 μm. (h) 3-color imaging performed on the same type of organoids using a commercial labeling reagent (ORGANELLE-ID-RGB), which contains a mixture of 3 dyes targeting nuclei, mitochondria, and lysosomes. Scale bar 20 μm. In the zoom-in, scale bar is 5 μm. (i) Average fluorescence intensity as a function of the 4 channels covering the spectral range between 525 and 725 nm, for the sample of Nile Red in HeLa cells. (j) Average fluorescence intensity as a function of the 4 channels covering the spectral range between 525 and 725 nm, for the sample of Nile Red in organoids.
Fig. 5
Fig. 5
4C-spectral phasor unmixing of green and yellow fluorescent proteins expressed in HEK293T cells. (a) 4-channel imaging of HEK293T cells expressing only mEmerald-actin and corresponding phasor plot. (b) 4-channel imaging of HEK293T cells expressing only EYFP-tagged CAAX (EYFP-CAAX) and corresponding phasor plot. (c)  4-channel imaging of HEK293T cells co-expressing mEmerald-actin and EYFP-tagged CAAX (EYFP-CAAX) and corresponding phasor plot. The elongated phasor plot reflects the presence of two distinct fluorescent species in the image. (d)  Emission detected in 4 channels covering the range between 495 and 615 nm, with a spectral detection window of 30 nm for each channel. (e) The phase wavelength image reveals cells with different spectral fingerprints, such as a cell predominantly expressing EYFP-CAAX (indicated by a star) or a cell predominantly expressing mEmerald-actin (indicated by an arrowhead). (f) Phasor decomposition provides spectrally unmixed images corresponding to the two fluorescent proteins.

References

    1. Garini, Y., Young, I. T. & McNamara, G. Spectral imaging: principles and applications. Cytometry Part. A. 69A, 735–747 (2006). - PubMed
    1. Zimmermann, T., Rietdorf, J. & Pepperkok, R. Spectral imaging and its applications in live cell microscopy. FEBS Lett.546, 87–92 (2003). - PubMed
    1. Sezgin, E., Waithe, D., Bernardino de la Serna, J. & Eggeling, C. Spectral imaging to measure heterogeneity in membrane lipid packing. ChemPhysChem16, 1387–1394 (2015). - PMC - PubMed
    1. Gao, L. & Smith, R. T. Optical hyperspectral imaging in microscopy and spectroscopy—a review of data acquisition. J. Biophoton. 8, 441–456 (2015). - PMC - PubMed
    1. Mukherjee, T. et al. Live-cell imaging of the nucleolus and mapping mitochondrial viscosity with a dual function fluorescent probe. Org. Biomol. Chem.19, 3389–3395 (2021). - PubMed

MeSH terms

Substances

LinkOut - more resources