. 2025 Oct;5(10):2022-2038.
doi: 10.1038/s43587-025-00946-7. Epub 2025 Aug 26.

Mevalonate metabolites boost aged oocyte quality through prenylation of small GTPases

Affiliations

Mevalonate metabolites boost aged oocyte quality through prenylation of small GTPases

Chuanming Liu et al. Nat Aging. 2025 Oct.

Abstract

Declining oocyte quality is the major contributor to female subfertility in aged mammals. Currently, there are no effective interventions to ameliorate aged oocyte quality. Here we found that oocytes at metaphase I from the cumulus-oocyte complexes of aged mice showed reduced cortical F-actin and lower levels of mevalonate (MVA) pathway metabolites, including MVA, farnesyl pyrophosphate (FPP) and geranylgeranyl pyrophosphate. We further showed that MVA supplementation improved FPP levels, cortical F-actin and the quality of aged oocytes. Mechanistically, we found that MVA supplementation induced granulosa cells to synthesize FPP, which was subsequently transferred to aged oocytes. Transported FPP increased the prenylation of small GTPases, including CDC42 and RAC1, and promoted membrane localization of CDC42-N-WASP-Arp2/3 and RAC1-WAVE2-Arp2/3 complexes, promoting cortical F-actin reassembly and reducing aneuploidy of aged oocytes. We also identified a natural chemical compound, 8-isopentenyl flavone, with an isopentenyl side chain from Epimedium brevicornu Maxim, which could increase CDC42 and RAC1 prenylation, improving the cortical F-actin and the competence of aged oocytes, and ameliorating reproductive outcomes in aged female mice. Collectively, increasing the prenylation of small GTPases via MVA metabolites or 8-isopentenyl flavone provides a therapeutic approach for boosting female fertility during reproductive aging.


Conflict of interest statement

Competing interests: The authors declare no competing interests.

Figures
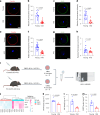
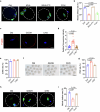
Fig. 1
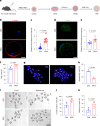
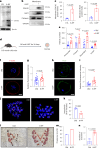
Fig. 1. Decreased cortical F-actin distribution and MVA pathway metabolites in aged oocytes.
a, Fluorescence imaging showing F-actin expression at the MI oocyte cortex from the young and old groups. Young group: COCs from young mice (6 weeks old) cultured in MEMα maturation medium; old group: COCs from aged mice (10 months old) cultured in MEMα maturation medium. Scale bar, 25 µm. b, F-actin fluorescence intensity in the young (n = 17 oocytes) and old (n = 25 oocytes) groups. c, Fluorescence imaging showing Arp3 expression at the MI oocyte cortex from the young and old groups. Scale bar, 25 µm. d, Arp3 fluorescence intensity in the young (n = 20 oocytes) and old (n = 20 oocytes) groups. e, Fluorescence imaging showing F-actin expression at the MI oocyte cortex from the young and ATO groups. Young group: COCs from young mice (6 weeks old) cultured in MEMα maturation medium; ATO group: COCs from young mice (6 weeks old) cultured in MEMα maturation medium with 40 µM atorvastatin. Scale bar, 25 µm. f, F-actin fluorescence intensity in the young (n = 26 oocytes) and ATO (n = 24 oocytes) groups. g, Fluorescence imaging showing Arp3 expression at the MI oocyte cortex from the young and ATO groups. Scale bar, 25 µm. h, Arp3 fluorescence intensity in the young (n = 20 oocytes) and ATO (n = 20 oocytes) groups. i, Schematic illustration showing the collection of MI oocytes from 6-week-old mice and 10-month-old mice for targeted metabolomics. YMIO, MI oocyte from young mice (6 weeks old); OMIO, MI oocyte from aged mice (10 months old). j, Heatmaps showing the abundance of MVA, FPP and GGPP in oocytes by LC–MS/MS analysis. The scaled value bar indicates the relative concentration. km, Box plot showing the levels of MVA (k), FPP (l) and GGPP (m) per MI oocyte from young and aged mice. The data are shown as the mean ± s.e.m. of seven independent experiments. An unpaired two-tailed Student’s t-test was used for statistical analysis. Panel i created with BioRender.com. Source data
Fig. 2
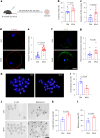
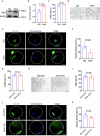
Fig. 2. MVA promotes cortical F-actin assembly and aged oocyte quality via the surrounding GCs in vitro.
a, Schematic illustration of the experimental protocol used to analyze the effect of MVA supplementation on the mouse oocyte meiotic process. b, Fluorescence imaging showing F-actin expression at the oocyte cortex in the old and MVA groups. Old group: COCs from aged mice (10 months old) cultured in MEMα maturation medium; MVA group: COCs from aged mice (10 months old) cultured in MEMα maturation medium with 50 µM MVA. Scale bar, 25 µm. c, F-actin fluorescence intensity in the old (n = 25 oocytes) and MVA (n = 28 oocytes) groups. d, Fluorescence imaging showing Arp3 expression at the oocyte cortex in the old and MVA groups. Scale bar, 25 µm. e, Arp3 fluorescence intensity in the old (n = 13 oocytes) and MVA (n = 13 oocytes) groups. f, Rate of PBE in the old (n = 76 oocytes) and MVA (n = 83 oocytes) groups. The data are shown as the mean ± s.e.m. of six independent experiments. g, Chromosome spread analysis showing representative images of aneuploid and euploid MII oocytes from the old and MVA groups. h, Rate of aneuploidy in the old (n = 33 oocytes) and MVA (n = 37 oocytes) groups. The data are shown as the mean ± s.e.m. of three independent experiments. i, Images of 2-cell embryos and blastocysts from the old and MVA groups. The arrowheads denote blastocysts. Scale bar, 100 µm. j,k, Rates of 2-cell embryos (j) and blastocysts (k) in the old (n = 78 oocytes) and MVA (n = 84 oocytes) groups. The data are shown as the mean ± s.e.m. of five independent experiments. An unpaired two-tailed Student’s t-test was used for statistical analysis. Panel a created with BioRender.com. Source data
Fig. 3
Fig. 3. MVA promotes cortical F-actin assembly and aged oocyte quality in vivo.
a, Schematic illustration of in vivo injection of MVA into 9-month-old mice. NS, normal saline. b, Ovarian index of mice in the old and MVA-injected groups. Old group: 9-month-old female mice intraperitoneally injected with normal saline every day for 30 days. MVA group: 9-month-old female mice intraperitoneally injected with 5 mg kg−1 MVA every day for 30 days. The data are shown as the mean ± s.e.m. of ten independent experiments. c, The number of MII oocytes in the old (n = 54 oocytes) and MVA-injected (n = 118 oocytes) groups. The data are shown as the mean ± s.e.m. of 12 independent experiments. d, Fluorescence imaging showing F-actin expression at the oocyte cortex in the old and MVA-injected groups. Scale bar, 25 µm. e, F-actin fluorescence intensity in the old (n = 15 oocytes) and MVA-injected (n = 21 oocytes) groups. f, Fluorescence imaging showing Arp3 expression at the oocyte cortex in the old and MVA-injected groups. Scale bar, 25 µm. g, Arp3 fluorescence intensity in the old (n = 9 oocytes) and MVA-injected (n = 8 oocytes) groups. h, Chromosome spread showing representative images of aneuploid and euploid MII oocytes from the old and MVA-injected groups. i, The aneuploidy rate was measured in the old (n = 59 oocytes) and MVA-injected (n = 50 oocytes) groups. The data are shown as the mean ± s.e.m. of five independent experiments. j, Images of two-cell embryos and blastocysts from the old and MVA-injected groups. The arrowheads indicate blastocysts. Scale bar, 200 µm. k,l, Two-cell-embryo (k) and blastocyst (l) rates were measured in the old (n = 51 oocytes) and MVA-injected (n = 63 oocytes) groups. The data are shown as the mean ± s.e.m. of three independent experiments. An unpaired two-tailed Student’s t-test was used for statistical analysis. Panel a created with BioRender.com. Source data
Fig. 4
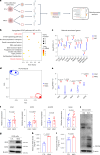
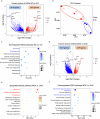
Fig. 4. MVA promotes the expression of meiosis-associated genes in oocytes from aged COCs and activates the FPP pathway in GCs.
a, Schematic showing the collection of oocytes and GCs from aged mice (10 months old) for RNA sequencing (RNA-seq). CTL, control. b, KEGG analysis of the upregulated DEGs in MO groups compared with the OO groups. OO group: oocytes from aged COCs cultured in MEMα maturation medium. MO group: oocytes from aged COCs cultured in MEMα maturation medium with 50 µM MVA. Statistical significance was determined by two-sided Fisher’s precision probability test. c, Violin plot showing the expression levels of meiosis-associated genes in OO groups and MO groups. d, PCA plot of GCs in the OGC groups and MGC groups based on gene expression patterns separated by PC1 and PC2. OGC group: GCs from aged COCs cultured in MEMα maturation medium. MGC group: GCs from aged COCs cultured in MEMα maturation medium with 50 µM MVA. e, Violin plot showing the expression levels of MVK, PMVK, MVD, IDI1 and FDPS in OGC groups and MGC groups based on the RNA-seq results. f, mRNA levels of the MVK, FDPS, GGPPS and SQLE genes in aged GCs from the OGC groups and MGC groups. The data are shown as the mean ± s.e.m. of ten independent experiments. g, MVK and FDPS protein expression in KGN cells (human granulosa-like tumor cell line) treated with 50 µM MVA. h,i, Box plot showing the levels of MVA (h) and FPP (i) in primary mouse GCs treated with or without 50 µM MVA. The data are shown as the mean ± s.e.m. of four independent experiments. j, Prenylation levels in aged oocytes treated with 50 µM MVA. The membrane was incubated with rabbit polyclonal anti-farnesyl. The molecular weight of small GTPases is around 26 kDa (arrow). Data are presented as the mean ± s.e.m. An unpaired two-tailed Student’s t-test was used for statistical analysis. Panel a created with BioRender.com. Source data
Fig. 5
Fig. 5. MVA promotes aged oocyte cortical F-actin assembly via prenylation by FPP from GCs.
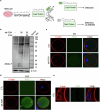
a, Fluorescence imaging showing F-actin expression at the oocyte cortex in the old, MVA, MVA + FTI and FOH groups. Old group: COCs from aged mice (10 months old) cultured in MEMα maturation medium; MVA group: COCs from aged mice (10 months old) cultured in MEMα maturation medium supplemented with 50 µM MVA; MVA + FTI group: COCs from aged mice (10 months old) cultured in MEMα maturation medium supplemented with 50 µM MVA and 10 µM FTI-277; FOH group: COCs from aged mice (10 months old) cultured in MEMα maturation medium supplemented with 10 µM FOH. Scale bar, 25 µm. b, F-actin fluorescence intensity in the old (n = 25 oocytes), MVA (n = 28 oocytes), MVA + FTI (n = 22 oocytes) and FOH (n = 43 oocytes) groups. c, Images of oocytes isolated from aged COCs of 10-month-old mice after 14 h of maturation in the old, MVA, MVA + FTI and FOH groups. Scale bar, 100 µm. d, Rate of PBE in the old (n = 44 oocytes), MVA (n = 56 oocytes), MVA + FTI (n = 43 oocytes) and FOH (n = 38 oocytes) groups. The data are shown as the mean ± s.e.m. of three independent experiments. e, Synthesis of the prenylation reporter alk-FOH. PPTS, pyridinium 4-toluenesulfonate. f, Western blotting analysis showing prenylated proteins in KGN cells treated with 0, 20, 50 and 100 µM alk-FOH. g, Western blotting analysis of prenylated protein expression around 26 kDa in the CTL, alk-FOH and alk-FOH + FOH groups. CTL group: KGN cells; alk-FOH group: KGN cells treated with 50 µM alk-FOH; alk-FOH + FOH group: KGN cells treated with 50 µM alk-FOH and 50 µM FOH. The data are shown as the mean ± s.e.m. of three independent experiments. h, Schematic of mouse DO and COC labeling. DOs and COCs were incubated with 50 µM alk-FOH for 14 h. i, Fluorescence imaging showing the alk-FOH signals (FITC labeled) in the gap junction from COCs after incubation with 50 µM alk-FOH for 14 h. The green particles indicated by the white arrowheads represent transported FPP between GCs and oocyte. The yellow fibers indicated by the white arrowheads denote the gap junctions between GCs and oocyte. Three experiments were repeated independently with similar results. Scale bar, 5 µm. Data are presented as the mean ± s.e.m. An unpaired two-tailed Student’s t-test was used for statistical analysis. Panels e and h created with BioRender.com. Source data
Fig. 6
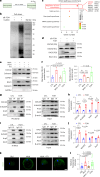
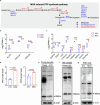
Fig. 6. Prenylation increases CDC42 and RAC1 cortical localization and F-actin assembly.
a, Schematic showing prenylated proteins with a CaaX motif. n = 2, farnesylated proteins; n = 3, geranylgeranylated proteins. b, Western blotting analysis of proteins after pull-down experiments in KGN cells. Three experiments were repeated independently with similar results. c, KEGG analysis of the 140 prenylated proteins. Padjust, P value adjusted. d, Western blotting analysis validated the labeling of the prenylated proteins CDC42 and RAC1 in KGN cells. PD, pull-down; TL, total. e, CDC42 and RAC1 protein expression in the membrane fractions of CTL, MVA, MVA + FTI and FOH groups. CTL group: KGN cells cultured in DMEM/F12 medium; MVA group: KGN cells cultured in DMEM/F12 medium supplemented with 50 µM MVA; MVA + FTI group: KGN cells cultured in DMEM/F12 medium supplemented with 50 µM MVA and 10 µM FTI-277; FOH group: KGN cells cultured in DMEM/F12 medium supplemented with 10 µM FOH. f, Western blotting analysis of CDC42 and RAC1 expression in the membrane fractions of CTL, MVA, MVA + FTI and FOH groups. The data are shown as the mean ± s.e.m. of three independent experiments. g,h, Endogenous CDC42–N-WASP, CDC42–Arp2 and CDC42–Arp3 interactions were detected by immunoprecipitation analysis in KGN cells with or without FOH treatment (g), and relative protein expression was determined (h). The data are shown as the mean ± s.e.m. of three independent experiments. i,j, Endogenous RAC1–WAVE2, RAC1–Arp2 and RAC1–Arp3 interactions were detected by immunoprecipitation analysis in KGN cells with or without FOH treatment (i), and relative protein expression was determined (j). The data are shown as the mean ± s.e.m. of three independent experiments. k, Fluorescence imaging showing Arp3 expression at the oocyte cortex in the old, MVA, MVA + FTI and FOH groups. Old group: COCs from aged mice (10 months old) cultured in MEMα maturation medium; MVA group: COCs from aged mice (10 months old) cultured in MEMα maturation medium supplemented with 50 µM MVA; MVA + FTI group: COCs from aged mice (10 months old) cultured in MEMα maturation medium supplemented with 50 µM MVA and 10 µM FTI-277; FOH group: COCs from aged mice (10 months old) cultured in MEMα maturation medium supplemented with 10 µM FOH. Scale bar, 25 µm. l, Arp3 fluorescence intensity in the old (n = 15 oocytes), MVA (n = 15 oocytes), MVA + FTI (n = 15 oocytes) and FOH groups (n = 15 oocytes). Data are presented as the mean ± s.e.m. An unpaired two-tailed Student’s t-test was used for statistical analysis. Panel a created with BioRender.com. Source data
Fig. 7
Fig. 7. The natural isopentenyl compound 8-IPF facilitates cortical F-actin assembly in aged oocytes.
a, Prenylation levels in the CTL and 8-IPF groups. The molecular weight of small GTPases is around 26 kDa (arrow). 8-IPF group: KGN cells treated with 50 µg l−1 8-IPF. b, CDC42 and RAC1 protein expression in the membrane fractions of the CTL and 8-IPF groups. c, Western blotting analysis of CDC42 and RAC1 expression in the membrane fractions of the CTL and 8-IPF groups. The data are shown as the mean ± s.e.m. of three independent experiments. d, Schematic of 8-IPF supplementation in vivo. e, Follicle counts of old and 8-IPF-treated mouse ovaries. Old group: 9.5-month-old female mice intragastrically gavaged with normal saline for 14 days. 8-IPF group: 9.5-month-old female mice intragastrically gavaged with 5 mg kg1 d1 8-IPF for 14 days. The data are shown as the mean ± s.e.m. of seven independent experiments. f, Oocyte immunofluorescence showing the expression of F-actin at the oocyte cortex from the old and 8-IPF groups. Scale bar, 25 µm. g, Oocyte immunofluorescence intensity of F-actin in the old (n = 23 oocytes) and 8-IPF (n = 15 oocytes) groups. h, Fluorescence imaging showing Arp3 expression at the oocyte cortex in the old and 8-IPF groups. Scale bar, 25 µm. i, Arp3 fluorescence intensity in the old (n = 13 oocytes) and 8-IPF (n = 12 oocytes) groups. j, Images showing aneuploidy in MII oocytes from old groups and euploid MII oocytes from 8-IPF groups. k, Histogram showing the incidence of aneuploidy in MII oocytes from the old (n = 35 oocytes) and 8-IPF (n = 29 oocytes) groups. The data are shown as the mean ± s.e.m. of three independent experiments. l, Fertility of mice treated with normal saline or 8-IPF. m, Pregnancy rates in the old (n = 7) and 8-IPF-treated (n = 7) mice. n, Litter sizes in old (n = 4) and 8-IPF-treated (n = 6) mice. Data are presented as the mean ± s.e.m. An unpaired two-tailed Student’s t-test was used for statistical analysis. Panel d created with BioRender.com. Source data
Extended Data Fig. 1
Extended Data Fig. 1. Decreased Arp3 expression in oocytes from aged mice.
a, Arp3 protein expression in the MI oocytes from Young and Old groups. Young group: COCs from young mice (6 weeks old) cultured in MEMα maturation medium; Old group: COCs from aged mice (10 months old) cultured in MEMα maturation medium. b, Western blotting analysis of Arp3 expression in oocytes from Young and Old groups. The data are shown as the mean ± s.e.m. of four independent experiments. c, Arp3 protein expression in the MI oocytes from Young and ATO groups. Young group: COCs from young mice (6 weeks old) cultured in MEMα maturation medium; ATO group: COCs from young mice (6 weeks old) cultured in MEMα maturation medium with 40 µM atorvastatin. d, Western blotting analysis of Arp3 expression in oocytes from Young and ATO groups. The data are shown as the mean ± s.e.m. of three independent experiments. An unpaired two-tailed Student’s t test was used for statistical analysis. Source data
Extended Data Fig. 2
Extended Data Fig. 2. MVA supplementation has no effect on the meiotic process in DOs.
a, Arp3 protein expression in the MI oocytes from the Old and MVA groups. Old group: COCs from aged mice (10 months old) cultured in MEMα maturation medium; MVA group: COCs from aged mice (10 months old) cultured in MEMα maturation medium with 50 µM MVA. b, Western blotting analysis of Arp3 expression in oocytes from Old and MVA groups. The data are shown as the mean ± s.e.m. of three independent experiments. c, Rate of germinal vesicle breakdown (GVBD) in the Old (n = 61 oocytes) and MVA (n = 64 oocytes) groups. The data are presented as the mean ± s.e.m. of five independent experiments. d, Images of oocytes isolated from COCs after maturation for 14 h in the Old and MVA groups. Scale bar, 100 µm. e, Representative images of spindle morphology and chromosome alignment in the Old and MVA groups. Scale bar, 25 µm. f, Rate of meiotic defects was analyzed in the Old (n = 49 oocytes) and MVA (n = 43 oocytes) groups. The data are shown as the mean ± s.e.m. of at least three independent experiments. g, Rate of GVBD in the Old (DO) (n = 44 oocytes) and MVA (DO) (n = 46 oocytes) groups. Old (DO) group: DOs from aged mice (10 months old) cultured in MEMα maturation medium; MVA (DO) group: DOs from aged mice (10 months old) cultured in MEMα maturation medium with 50 µM MVA. The data are shown as the mean ± s.e.m. of three independent experiments. h, Images of oocytes after maturation for 14 h in the Old (DO) and MVA (DO) groups. Scale bar, 200 µm. i, PBE rate was measured in the Old (DO) (n = 42 oocytes) and MVA (DO) (n = 41 oocytes) groups. The data are shown as the mean ± s.e.m. of three independent experiments. j, Representative images of spindle morphology and chromosome alignment in the Old (DO) and MVA (DO) groups. Scale bar, 25 µm. k, Rate of the meiotic defects was analyzed in the Old (DO) (n = 34 oocytes) and MVA (DO) (n = 39 oocytes) groups. The data are shown as the mean ± s.e.m. of three independent experiments. An unpaired two-tailed Student’s t test was used for statistical analysis. Source data
Extended Data Fig. 3
Extended Data Fig. 3. MVA injection ameliorates aging-related ovarian reserve depletion in vivo.
a, Body weights of mice in the Old and MVA groups. Old group: 9-month-old female mice intraperitoneally injected with normal saline. MVA group: 9-month-old female mice intraperitoneally injected with 5 mg kg−1 MVA every day for 30 days. The data are shown as the mean ± s.e.m. of six independent experiments. b, Micrographs of ovaries from mice in the Old and MVA groups. Scale bar, 1 mm. c, HE-stained micrographs of ovaries from the Old and MVA group mice. Scale bar, 500 µm. d, The number of follicles in the Old and MVA groups. The data are shown as the mean ± s.e.m. of five independent experiments. e, Serum concentrations of E2 in the Old and MVA groups. The data are shown as the mean ± s.e.m. of five independent experiments. f, Serum concentrations of AMH in the Old and MVA groups. The data are shown as the mean ± s.e.m. of five independent experiments. g, Representative images of spindle morphology and chromosome alignment in the Old and MVA groups. Scale bar, 25 µm. h, Rate of the meiotic defects was analyzed in the Old (n = 51 oocytes) and MVA (n = 38 oocytes) groups. The data are shown as the mean ± s.e.m. of three independent experiments. An unpaired two-tailed Student’s t test was used for statistical analysis. Source data
Extended Data Fig. 4
Extended Data Fig. 4. RNA-seq analysis of oocytes and GCs in the Old and MVA groups.
a, Volcano plot showing DEGs (downregulated, blue; upregulated, red) in oocytes from the MO groups compared with those from the OO groups. OO group: oocytes from aged COCs cultured in MEMα maturation medium. MO group: oocytes from aged COCs cultured in MEMα maturation medium with 50 µM MVA. The highly expressed DEGs are listed. Statistical significance was determined by Wald chi-square test. b, PCA plot of oocyte gene expression patterns in the OO and MO groups separated by PC1 and PC2. c, KEGG analysis of the downregulated DEGs in MO groups compared with the OO groups. Statistical significance was determined by two-sided Fisher’s precision probability test. d, Volcano plot showing DEGs (downregulated, blue; upregulated, red) in GCs from the MGC groups compared with those from the OGC groups. OGC group: GCs from aged COCs cultured in MEMα maturation medium. MGC group: GCs from aged COCs cultured in MEMα maturation medium with 50 µM MVA. The highly expressed DEGs are listed. Statistical significance was determined by Wald chi-square test. e, KEGG analysis of the upregulated DEGs in MGC groups compared with the OGC groups. Statistical significance was determined by two-sided Fisher’s precision probability test. f, KEGG analysis of the downregulated DEGs in MGC groups compared with the OGC groups. Statistical significance was determined by two-sided Fisher’s precision probability test.
Extended Data Fig. 5
Extended Data Fig. 5. MVA activates FPP synthesis pathway-associated genes in GCs of aged COCs.
a, Overview of the MVA pathway status after MVA supplementation in GCs from aged COCs. The red font denotes upregulated genes. b, Violin plot showing the expression levels of ACAT2, HMGCS1, and HMGCR in OGC and MGC groups based on the RNA-seq results. OGC group: GCs from aged COCs cultured in MEMα maturation medium. MGC group: GCs from aged COCs cultured in MEMα maturation medium with 50 µM MVA. c, Violin plot showing the expression levels of GGPPS, SQLE, LSS, CYP51A1, TM7SF2, MSMO1, NSDHL, DHCR7, and DHCR24 in OGC and MGC groups based on the RNA-seq results. d, Western blotting analysis of MVK and FDPS expression in MVA-treated KGN cells. The data are shown as the mean ± s.e.m. of three independent experiments. e, Prenylation levels in young oocytes treated with 40 µM atorvastatin. The membrane was incubated with rabbit polyclonal anti-Farnesyl. The molecular weight of small GTPases is around 26 kDa (arrow). f, Prenylation levels in oocytes from young and aged COCs. The membrane was incubated with rabbit polyclonal anti-Farnesyl. The molecular weight of small GTPases is around 26 kDa (arrow). g, Prenylation levels in KGN cells treated with 50 µM MVA. The membrane was incubated with rabbit polyclonal anti-Farnesyl. The molecular weight of small GTPases is around 26 kDa (arrow). Data are presented as the mean ± s.e.m. An unpaired two-tailed Student’s t test was used for statistical analysis. Source data
Extended Data Fig. 6
Extended Data Fig. 6. The ameliorative effects of MVA on oocytes from aged COCs are mediated by protein prenylation.
a, Representative images of spindle morphology and chromosome alignment in the Old, MVA, MVA + FTI, and FOH groups. Old group: COCs from aged mice (10 months old) cultured in MEMα maturation medium; MVA group: COCs from aged mice (10 months old) cultured in MEMα maturation medium supplemented with 50 µM MVA; MVA + FTI group: COCs from aged mice (10 months old) cultured in MEMα maturation medium supplemented with 50 µM MVA and 10 µM FTI-277; FOH group: COCs from aged mice (10 months old) cultured in MEMα maturation medium supplemented with 10 µM FOH. Scale bar, 25 µm. b, Rate of the meiotic defects were analyzed in the Old (n = 30 oocytes), MVA (n = 34 oocytes), MVA + FTI (n = 37 oocytes), and FOH (n = 37 oocytes) groups. The data are shown as the mean ± s.e.m. of three independent experiments. c, Fluorescence imaging showing F-actin expression at the oocyte cortex in the Old, GGOH, and CHO groups. Old group: COCs from aged mice (10 months old) cultured in MEMα maturation medium; GGOH group: COCs from aged mice (10 months old) cultured in MEMα maturation medium with 10 µM GGOH; CHO group: COCs from aged mice (10 months old) cultured in MEMα maturation medium with 100 µM cholesterol. Scale bar, 25 µm. d, F-actin fluorescence intensity in the Old (n = 13 oocytes), GGOH (n = 15 oocytes), and CHO (n = 19 oocytes) groups. e, Rate of GVBD in the Old (n = 51 oocytes), GGOH (n = 36 oocytes), and CHO (n = 51 oocytes) groups. The data are shown as the mean ± s.e.m. of three independent experiments. f, Images of oocytes after maturation for 14 h in the Old, GGOH, and CHO groups. Scale bar, 200 µm. g, PBE rate was measured in the Old (n = 51 oocytes), GGOH (n = 36 oocytes), and CHO (n = 51 oocytes) groups. The data are shown as the mean ± s.e.m. of three independent experiments. h, Representative images of spindle morphology and chromosome alignment in the Old, GGOH, and CHO groups. Scale bar, 25 µm. i, Rate of the meiotic defects was analyzed in the Old (n = 41 oocytes), GGOH (n = 31 oocytes), and CHO (n = 42 oocytes) groups. Data are presented as the mean ± s.e.m. An unpaired two-tailed Student’s t test was used for statistical analysis. Source data
Extended Data Fig. 7
Extended Data Fig. 7. Granulosa cells uptake FPP and transfer to oocytes.
a, Schematic of the metabolic labelling of KGN cells with alk-FOH and subsequent CuAAC ligation with biorthogonal detection tags for imaging or proteomics. b, Western blotting analysis showing prenylated proteins in KGN cells treated with alk-FOH (50 µM) with or without FOH (50 µM). Three experiments were repeated independently with similar results. c, Fluorescence imaging of DOs after incubation with (n = 10 oocytes) or without (n = 10 oocytes) 50 µM alk-FOH for 14 h. Scale bar, 5 µm. d, Fluorescence imaging of COCs after incubation with (n = 10 COCs) or without (n = 10 COCs) 50 µM alk-FOH for 14 h. O: oocyte. GC: granulosa cell. Scale bar, 5 µm. e, Fluorescence imaging showing the alk-FOH signals in the gap junction from COCs in the CTL group (n = 10 COCs). CTL group: COCs cultured in MEMα maturation medium without alk-FOH for 14 h. Scale bar, 5 µm. Panel a created with BioRender.com. Source data
Extended Data Fig. 8
Extended Data Fig. 8. Identification of putative prenylated proteins.
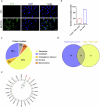
a, Fluorescence imaging of KGN cells after incubation with 50 µM alk-FOH for 24 h. Three experiments were repeated independently with similar results. Scale bar, 50 µm. b, The number of proteins labelled by alk-FOH with a carboxyl-terminal CaaX/Rab motif or without the motif. c, Protein localization of identified proteins predicted by UniProt analysis. d, Overlap of identified proteins with a carboxyl-terminal CaaX or Rab motif and proteins located on the cell membrane. e, Proteins labelled with alk-FOH with a carboxyl-terminal CaaX/Rab motif and located on the cell membrane. Panel e created with BioRender.com. Source data
Extended Data Fig. 9
Extended Data Fig. 9. MVA induces cortical localization of CDC42 and RAC1 via prenylation.
a, Fluorescence imaging showing CDC42 expression in oocytes from the Old, Old+MVA, and Old+MVA + FTI groups. Old group: COCs from aged mice (10 months old) cultured in MEMα maturation medium; MVA group: COCs from aged mice (10 months old) cultured in MEMα maturation medium supplemented with 50 µM MVA; MVA + FTI group: COCs from aged mice (10 months old) cultured in MEMα maturation medium supplemented with 50 µM MVA and 10 µM FTI-277. Scale bar, 25 µm. b, CDC42 fluorescence intensity in the Old (n = 11 oocytes), Old+MVA (n = 11 oocytes), and Old+MVA + FTI (n = 11 oocytes) groups. c, Fluorescence imaging showing RAC1 expression in oocytes from the Old, Old+MVA, and Old+MVA + FTI groups. Scale bar, 25 µm. d, RAC1 fluorescence intensity in the Old (n = 13 oocytes), Old+MVA (n = 13 oocytes), and Old+MVA + FTI (n = 14 oocytes) groups. e, Representative images of CDC42 distribution in oocytes injected with CDC42 mRNA (n = 5 oocytes) or CDC42-C188Y (M-CDC42) mRNA (n = 5 oocytes). Scale bar, 10 µm. f, Representative images of RAC1 distribution in oocytes injected with RAC1 mRNA (n = 5 oocytes) or RAC1-C189Y (M-RAC1) mRNA (n = 5 oocytes). Scale bar, 10 µm. g, Fluorescence imaging showing Arp3 expression at the oocyte cortex in the Old, GGOH, and CHO groups. Old group: COCs from aged mice (10 months old) cultured in MEMα maturation medium; GGOH group: COCs from aged mice (10 months old) cultured in MEMα maturation medium with 10 µM GGOH; CHO group: COCs from aged mice (10 months old) cultured in MEMα maturation medium with 100 µM cholesterol. Scale bar, 25 µm. h, Arp3 fluorescence intensity in the Old (n = 17 oocytes), GGOH (n = 16 oocytes), and CHO (n = 22 oocytes) groups. Data are presented as the mean ± s.e.m. An unpaired two-tailed Student’s t test was used for statistical analysis. Source data
Extended Data Fig. 10
Extended Data Fig. 10. 8-IPF ameliorates ovarian reserve and embryo development in aged mice.
a, Western blotting analysis of MVK and FDPS expression in aged mouse GCs treated with 8-IPF. b, MVK and FDPS protein levels in 8-IPF-treated aged mouse GCs. The data are shown as the mean ± s.e.m. of three independent experiments. c, Micrographs of ovaries from the Old and 8-IPF groups. Old group: 9.5-month-old female mice intragastrically gavaged with normal saline. 8-IPF group: 9.5-month-old female mice intragastrically gavaged with 5 mg/kg/d 8-IPF for 14 days. Scale bar, 1 mm. d, Ovarian index of the Old and 8-IPF groups. The data are shown as the mean ± s.e.m. of fourteen independent experiments. e, HE-stained micrographs of mouse ovaries from the Old and 8-IPF groups. Scale bar, 50 µm or 500 µm. f, Serum concentrations of E2 in the Old and 8-IPF groups. The data are shown as the mean ± s.e.m. of seven independent experiments. g, Serum concentrations of AMH in the Old and 8-IPF groups. The data are shown as the mean ± s.e.m. of seven independent experiments. h, The number of MII oocytes in the Old (n = 26 oocytes) and 8-IPF (n = 73 oocytes) groups. The data are shown as the mean ± s.e.m. of seven independent experiments. i, Arp3 protein expression in the MI oocytes from the Old and 8-IFP groups. j, Western blotting analysis of Arp3 expression in oocytes from Old and 8-IPF groups. The data are shown as the mean ± s.e.m. of three independent experiments. k, Morphologies of spindles and chromosomes in MII oocytes derived from Old and 8-IPF groups. Scale bar, 25 µm. l, The meiotic defect rates of MII oocytes derived from Old (n = 31 oocytes) and 8-IPF (n = 37 oocytes) groups. The data are shown as the mean ± s.e.m. of three independent experiments. m, Micrographs of in vitro fertilization (IVF) outcomes in the Old and 8-IPF groups. The arrowheads indicate blastocysts. Scale bar, 200 µm. n-o, Rates of 2-cell embryos and blastocysts in the Old (n = 41 oocytes) and 8-IPF (n = 39 oocytes) groups. The data are shown as the mean ± s.e.m. of three independent experiments. An unpaired two-tailed Student’s t test was used for statistical analysis. Source data

References

    1. Broekmans, F. J., Soules, M. R. & Fauser, B. C. Ovarian aging: mechanisms and clinical consequences. Endocr. Rev.30, 465–493 (2009). - PubMed
    1. Laisk, T. et al. Demographic and evolutionary trends in ovarian function and aging. Hum. Reprod. Update25, 34–50 (2019). - PubMed
    1. Perheentupa, A. & Huhtaniemi, I. Aging of the human ovary and testis. Mol. Cell. Endocrinol.299, 2–13 (2009). - PubMed
    1. Gruhn, J. R. et al. Chromosome errors in human eggs shape natural fertility over reproductive life span. Science365, 1466–1469 (2019). - PMC - PubMed
    1. Nikalayevich, E. et al. Aberrant cortex contractions impact mammalian oocyte quality. Dev. Cell59, 841–852.e7 (2024). - PubMed

LinkOut - more resources