. 2025 Aug 26;15(1):31331.
doi: 10.1038/s41598-025-17356-9.

Revealing the protective potential of D-(-)-Quinic acid against thioacetamide-induced hepatic encephalopathy in rats

Affiliations

Revealing the protective potential of D-(-)-Quinic acid against thioacetamide-induced hepatic encephalopathy in rats

Sedat Ciftel et al. Sci Rep. .

Abstract

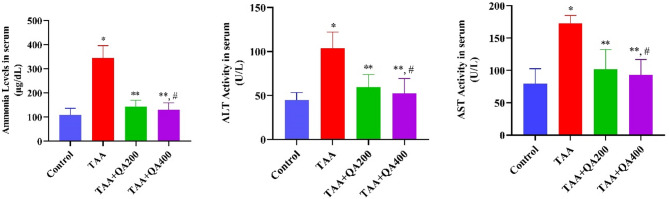
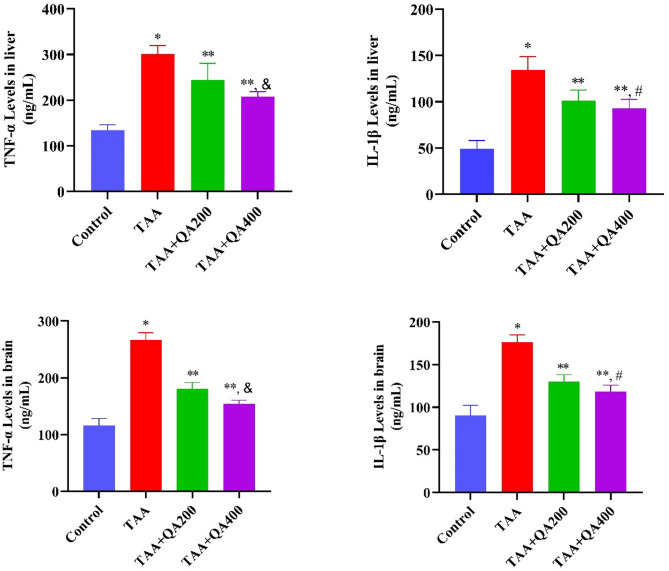
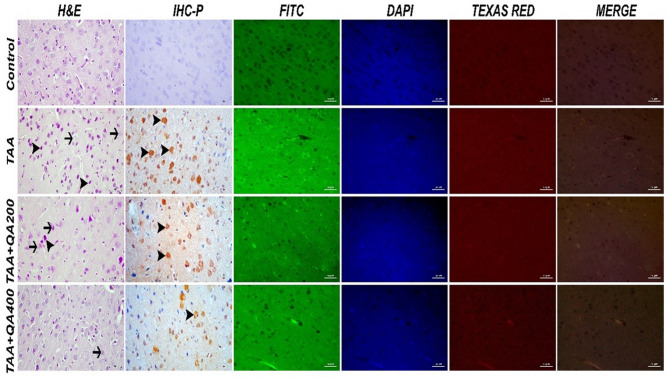
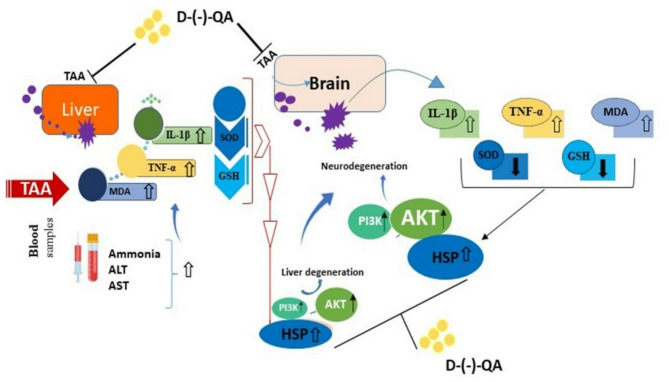
The objective of this study was to elucidate the impact of D-(-)-Quinic acid (D-(-)-QA), a natural phenolic acid, on the molecular mechanisms of inflammation and oxidative stress in brain and liver damage in thioacetamide (TAA)-induced hepatic encephalopathy (HE) in rats. To establish an experimental HE model, rats were injected with three doses (200 mg/kg, intraperitoneally) of TAA every other day, followed by the administration of D-(-)- QA (200 or 400 mg/kg, orally) for fourteen days. Serum ammonia, alanine transaminase (ALT), and aspartate transaminase (AST) levels were detected. Tumor necrosis factor (TNF-α), interleukin-1beta IL-1β, and malondialdehyde (MDA), superoxide dismutase (SOD), and glutathione (GSH) levels were analyzed to assess inflammation and oxidative damage in brain and liver tissues. Histopathological examinations, immunofluorescence (PI3K and AKT expressions), and immunohistochemical (HSP70 expression) examinations were also performed. TAA administration causedhyperammonemia and increased ALT and AST levels, along with histopathological changes indicating damage to hepatocytes and neurons. Additionally, it disrupted the inflammatory response and promoted oxidative damage by activating the PI3K/AKT-related HSP70 response in the brain and liver. Treatment with D-(-)-QA significantly prevented the increase in ammonia levels and improved the liver function. In addition, the increase in TNF-α, and IL-1β, proinflammatory cytokines in liver and brain tissues as well as the increase in MDA and decrease in SOD and GSH were significantly suppressed by D-(-)-QA. By suppressing HSP70 and PI3K/AKT signaling in brain and liver tissues, D-(-)-QA administration attenuated inflammation and oxidative damage. D-(-)-QA may be an alternative to current clinical interventions by inhibiting inflammation and oxidative damage signaling toward the pathogenesis of HE.

Keywords: D-(-)-Quinic acid; HSP70; Hepatic encephalopathy; Inflammation; Oxidative stress; PI3K/AKT signaling; Thioacetamide.


Conflict of interest statement

Declarations. Competing interests: The authors declare no competing interests. Ethical approval: The study protocol was approved by Erzincan Binali Yıldırım University Experimental Animal Ethics Committee with the decision dated 31.10.2024 and numbered 47. All experiments were carried out in accordance with European Parliament Directive 2010/63/EU (Approval Number 2016-24-199) and ARRIVE guidelines.

Figures

Fig. 1
Fig. 1
Experimental procedure of the present study. Control group (n = 6), TAA group (n = 6): 200 mg/kg TAA, TAA + QA200 group (n = 6): 200 mg/kg TAA + 200 mg/kg D-(-)-Quinic Acid, TAA + QA400 group (n = 6): 200 mg/kg TAA + 400 mg/kg D-(-)-Quinic Acid.
Fig. 2
Fig. 2
Comparison of serum ammonia, ALT and AST levels between experimental groups. Bars show mean ± standard deviation, n = 6. *: p < 0.001 vs. Control group, **: p < 0.001 vs. TAA group, #: p > 0.05 vs. TAA + QA200 group, ALT: alanine transaminase, AST: aspartate transaminase, TAA group: 200 mg/kg TAA, TAA + QA200 group: 200 mg/kg TAA + 200 mg/kg D-(-)-Quinic Acid, TAA + QA400 group: 200 mg/kg TAA + 400 mg/kg D-(-)-Quinic Acid.
Fig. 3
Fig. 3
Comparison of proinflammatory cytokine levels in liver and brain tissues of experimental groups. Bars show mean ± standard deviation, n = 6. *: p < 0.001 vs. Control group, **: p < 0.001 vs. TAA group, #: p > 0.05 vs. TAA + QA200 group, &: p < 0.05 vs. TAA + QA200 group, TNF-α: tumor necrosis factor-alpha, IL-1β: interleukin 1β, TAA group: 200 mg/kg TAA, TAA + QA200 group: 200 mg/kg TAA + 200 mg/kg D-(-)-Quinic Acid, TAA + QA400 group: 200 mg/kg TAA + 400 mg/kg D-(-)-Quinic Acid.
Fig. 4
Fig. 4
Comparison of oxidant and antioxidant levels in liver and brain tissues of experimental groups. Bars show mean ± standard deviation, n = 6. *: p < 0.001 vs. Control group, **: p < 0.001 vs. TAA group, #: p > 0.05 vs. TAA + QA200 group, &: p < 0.05 vs. TAA + QA200 group, MDA: malondialdehyde, tGSH: total glutathione, SOD: superoxide dismutase, TAA group: 200 mg/kg TAA, TAA + QA200 group: 200 mg/kg TAA + 200 mg/kg D-(-)-Quinic Acid, TAA + QA400 group: 200 mg/kg TAA + 400 mg/kg D-(-)-Quinic Acid.
Fig. 5
Fig. 5
Grading of histopathological damage in liver and brain tissues of experimental groups. Bars show mean ± standard deviation, n = 6. *: p < 0.01 vs. Control group, **: p < 0.05 vs. TAA group, #: p < 0.01 vs. TAA + QA200 group, &: p < 0.05 vs. TAA + QA200. TAA group: 200 mg/kg TAA, TAA + QA200 group: 200 mg/kg TAA + 200 mg/kg D-(-)-Quinic Acid, TAA + QA400 group: 200 mg/kg TAA + 400 mg/kg D-(-)-Quinic Acid.
Fig. 6
Fig. 6
Liver tissues, hepatocyte degeneration (arrows) and necrosis (arrowheads), H&E; HSP70 expression in hepatocytes (arrowheads), IHC-P, Bar: 40 μm; PI3 kinase (FITC) and pan-AKT (Texas Red) expressions in hepatocytes, IF, Bar: 50 μm. n = 6/each group. TAA group: 200 mg/kg TAA, TAA + QA200 group: 200 mg/kg TAA + 200 mg/kg D-(-)-Quinic Acid, TAA + QA400 group: 200 mg/kg TAA + 400 mg/kg D-(-)-Quinic Acid.
Fig. 7
Fig. 7
Brain tissues, degeneration (arrows) and necrosis (arrowheads) in neurons, H&E; HSP70 expressions in neurons (arrowheads), IHC-P, Bar: 40 μm; PI3 kinase (FITC) and pan-AKT (Texas Red) expressions in neurons, IF, Bar: 50 μm. n = 6/each group. TAA group: 200 mg/kg TAA, TAA + QA200 group: 200 mg/kg TAA + 200 mg/kg D-(-)-Quinic Acid, TAA + QA400 group: 200 mg/kg TAA + 400 mg/kg D-(-)-Quinic Acid.
Fig. 8
Fig. 8
Expressions of HSP70, PI3K, and AKT in liver and brain tissues of experimental groups. n = 6/each group. *: p < 0.001 vs. Control group, **: p < 0.001 vs. TAA group, #: p < 0.001 vs. TAA + QA200 group. HSP70: Heat shock protein 70, PI3K: phosphoinositide 3-kinase, AKT: protein kinase B, TAA group: 200 mg/kg TAA, TAA + QA200 group: 200 mg/kg TAA + 200 mg/kg D-(-)-Quinic Acid, TAA + QA400 group: 200 mg/kg TAA + 400 mg/kg D-(-)-Quinic Acid.
Fig. 9
Fig. 9
Protective role of D-(-)-Quinic acid against thioacetamide-induced hepatic encephalopathy in rats via targeting oxido-inflammatory routes and PI3K/AKT-related HSP70 signaling pathway.

References

    1. Ke, Q. et al. Safety and efficacy of interventional embolization in cirrhotic patients with refractory hepatic encephalopathy associated with spontaneous portosystemic shunts. Sci. Rep.14, 14848 (2024). - PMC - PubMed
    1. Hadjihambi, A., Arias, N., Sheikh, M. & Jalan, R. Hepatic encephalopathy: a critical current review. Hepatol. Int.12, 135–147 (2018). - PMC - PubMed
    1. Ochoa-Sanchez, R. & Rose, C. F. Pathogenesis of hepatic encephalopathy in chronic liver disease. J. Clin. Exp. Hepatol.8, 262–271 (2018). - PMC - PubMed
    1. Lu, K. Cellular pathogenesis of hepatic encephalopathy: an update. Biomolecules13, 396 (2023). - PMC - PubMed
    1. Tranah, T. H., Vijay, G. K., Ryan, J. M. & Shawcross, D. L. Systemic inflammation and ammonia in hepatic encephalopathy. Metab. Brain Dis.28, 1–5 (2013). - PubMed

MeSH terms

LinkOut - more resources