. 2025 Oct;17(10):2562-2585.
doi: 10.1038/s44321-025-00290-8. Epub 2025 Aug 26.

Dominant negative ATP5F1A variants disrupt oxidative phosphorylation causing neurological disorders

Affiliations

Dominant negative ATP5F1A variants disrupt oxidative phosphorylation causing neurological disorders

Sara M Fielder et al. EMBO Mol Med. 2025 Oct.

Abstract

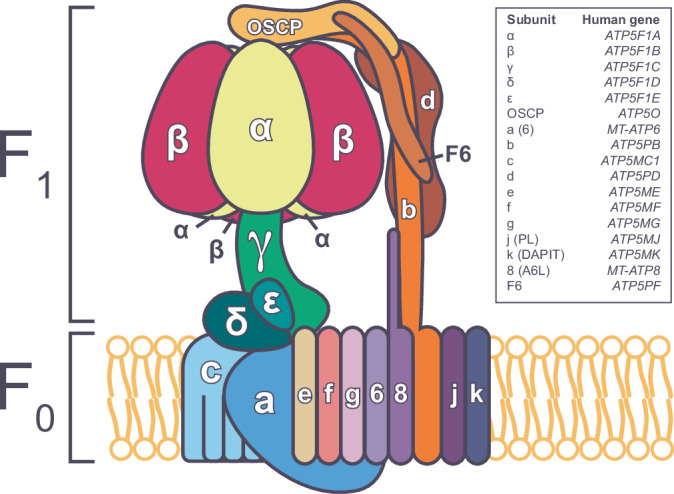
ATP5F1A encodes the α-subunit of complex V of the respiratory chain, which is responsible for mitochondrial ATP synthesis. We describe 6 probands with heterozygous de novo missense ATP5F1A variants that presented with developmental delay, intellectual disability, and movement disorders. All variants were located at the contact points between the α- and β-subunits. Functional studies in C. elegans revealed that the variants were damaging via a dominant negative genetic mechanism. Biochemical and proteomics studies of proband-derived cells showed a marked reduction in complex V abundance and activity. Mitochondrial physiology studies revealed increased oxygen consumption, yet decreased mitochondrial membrane potential and ATP levels indicative of uncoupled oxidative phosphorylation as a pathophysiologic mechanism. Our findings contrast with the previously reported ATP5F1A variant, p.Arg207His, indicating a different pathological mechanism. This study expands the phenotypic and genotypic spectrum of ATP5F1A-associated conditions and highlights how functional studies can provide an understanding of the genetic, molecular, and cellular mechanisms of ATP5F1A variants of uncertain significance. With 12 heterozygous individuals now reported, ATP5F1A is the most frequent nuclear genome cause of complex V deficiency.

Keywords: ATP Synthase; ATP5F1A; Complex V; Mitochondriopathy; Oxidative Phosphorylation.


Conflict of interest statement

Disclosure and competing interests statement. The authors declare no competing interests.

Figures

Figure 1
Figure 1. A schematic of ATP synthase (Complex V).
Human mitochondrial ATP synthase is comprised of two domains, F1 and Fo. F1 consists of α, β, γ, δ, and ε-subunits at a ratio of 3:3:1:1:1, and forms the catalytic activity domain where ATP synthesis occurs. Fo forms the proton pore and consists of a membrane-embedded central ring organized by repeating c subunits, and a, e, f, g, j, k, and 8 subunits. A peripheral arm consisting of the b, d, and F6 subunits links to the catalytic head through the ATP5PO (also known as oligomycin sensitivity-conferring protein (OSCP)) subunit, and is embedded in the inner mitochondrial membrane.
Figure 2
Figure 2. Proband ATP5F1A variants likely disrupt interaction between α, β, and γ subunits.
Proband variants are located at the interfaces of α:β, and α:γ subunits. Locations of the four variants in a single α−β dimer (A), or in the hexameric complex with the γ subunit (B). α-subunit is depicted in dark blue, β-subunit in orange, γ-subunit in yellow, and variant locations are shown in cyan. (C, D) Close up schematic of wild-type and variant interactions in the holocomplex. Wild-type residues in cyan, proband variant residues in magenta, other residues in α-, β- and γ-subunits are in dark blue, orange, and yellow, respectively. The P331L, S346F and R182Q substitutions are predicted to destroy H-bonds and/or impact the conformation and interaction between α, β, and γ subunits. The L109S substitution creates two novel H-bonds between α, and β subunits which likely alters the interaction between these subunits.
Figure 3
Figure 3. P316L, S331F, and R167Q variants are damaging to atp-1 function in C. elegans.
(A) R182, P331, and S346 residues are in areas of high conservation across multiple species, and all three residues are conserved in the C. elegans homolog atp-1. hs- human, mm- mouse, rn- rat, xt- xenopus, dr- zebrafish, dm- Drosophila, ce- C. elegans. (B) Schematic of how variant modeling in C. elegans aids in molecular diagnosis of rare disease. (C) Schematic of atp-1 extra copy lines generated that have endogenous atp-1 on chromosome I, and a single copy transgene insertion of wild-type atp-1 on chromosome IV. (D) Development of heterozygous variant animals scored at 72 h after embryo laying. Data from 4 biological replicates are shown. The exact number of animals scored for each genotype is shown in Appendix Table S5. More information on the experiment and the crossing scheme used to generate these animals can be found in the Materials and Methods and in Appendix Fig. S7. (E) Representative images of animals in (D). Scale bar, 100 µm. (F) Length of heterozygous variant animals 24 h post L4 larval stage as measured by WormLab over a two-minute recording. Data for the P316L, S331F and R167Q variants are from 3, 4 and 5 biological replicates, respectively. Each data point represents measurements from a single animal. The exact number of animals analyzed for each genotype is shown in Appendix Table S5. Mean and SD plotted, one-way ANOVA followed by post-hoc Holm–Sidak tests. (G) Crawling speeds of heterozygous variant animals 24 h post L4 larval stage as measured by WormLab. Data for the P316L, S331F and R167Q variants are from 3, 3 and 4 biological replicates, respectively. Each data point represents measurements from a single animal. The exact number of animals analyzed for each genotype is shown in Appendix Table S5. Mean and SD shown. One-way ANOVA followed by post-hoc Holm–Sidak analysis for normal distribution were performed. A Kruskall–Wallis test was performed followed by Dunn’s comparison for non-normally distributed data. *P < 0.05, ****P < 0.0001. Source data are available online for this figure.
Figure 4
Figure 4. atp-1 P316L, S331F, and R167Q variants induce mitochondrial stress.
(A) Schematic of the hsp-6p::gfp reporter expressing strain. GFP is not expressed under normal conditions. However, upon mitochondrial stress, the hsp-6p::gfp reporter is transcriptionally upregulated in the intestine of the animal. (BD) Normalized GFP fluorescence expression in 1-day adult animals. Data for (BD) are from 4, 4 and 3 biological replicates, respectively. Each data point represents measurements from a single well containing 10 animals per well. The exact number of animals analyzed for each genotype is shown in Appendix Table S5. Graphs display mean and SD. One-way ANOVA was performed to determine significance. (EG) Representative images of animals quantified in (BD). Scale bar, 100 µm. See Appendix Fig. S7 for crossing scheme to generate these animals. ns not significant, *P < 0.05, ***P < 0.001, ****P < 0.0001. Source data are available online for this figure.
Figure 5
Figure 5. atp-1 P316L variant alters mitochondrial morphology.
Mitochondrial morphology is altered in P316L animals. (A) Representative images of mitochondrial marker bcIs80 (myo-3p::mito-gfp) expressed in the body wall muscles. Arrows point to abnormal mitochondria. Nu marks the position of the nucleus. Scale bar, 5 µm. (B) Quantification of average area and minor axis length per animal, calculated using MitoSegNet. Data are from 3 biological replicates. Each data point represents measurements from a single animal. The exact number of animals analyzed for each genotype is shown in Appendix Table S5. Mean and SD are shown. One-way ANOVA performed followed by post-hoc Holm–Sidak tests. ns not significant, **P < 0.01, ***P < 0.001. Source data are available online for this figure.
Figure 6
Figure 6. Proband fibroblasts show reduced complex V abundance and activity.
(A) Schematic of mitochondrial functional studies performed on proband fibroblasts. (B) BN-PAGE analysis of complexes of the electron transport chain of proband 1 (p.Arg182Gln), proband 4 (p.Ser346Phe) and proband 6 (p.Leu109Ser) fibroblasts. (C) Western blots analysis of ATP5F1A, ATP5F1B and ATP5PO of proband and control fibroblasts. cs, citrate synthase, loading control. (D) Relative Complex Abundance (RCA) of OXPHOS complexes from proteomics data of Proband 2 (p.Arg182Gln) LCLs compared to controls (N = 4) showing an isolated Complex V defect. Middle bar represents mean complex abundance. Upper and lower bars represent 95% confidence interval. Significance was calculated from a two-sided t test between the individual protein means. CI: P = 0.23136; CII: P = 0.49824, CIII: P = 0.40071, CIV: P = 0.50014, CV: P = 0.00014. (E) Protein range for ATP5F1A in LCLs of Proband 2 (p.Arg182Gln) (red dot) and controls (N = 4, purple dots) showing a standard deviation of 8.7 from the control median. (F) Topographical heatmap of the log2 fold-change abundances of Proband 2 relative to controls onto the cryo-EM structure of the dimer complex V structure (PDB: 7AJD). Source data are available online for this figure.
Figure 7
Figure 7. ATP5F1A p.R182Q proband fibroblasts show reduced ATPase activity and uncoupled oxidative phosphorylation.
(A) Representative oxygen consumption rate (OCR) of proband-derived fibroblasts compared to age, race, and sex matched control fibroblasts measured by Seahorse in intact cells. Mean and SD of one representative experiment is shown. Individual graphs from each of the three biological replicates are shown in Appendix Fig. S5. (B) Normalized average basal, maximal, and spare OCR from three biological replicates. Mean and SEM of three biological replicates are shown. Significance was calculated using an unpaired t-test. Individual graphs from each experiment are shown in Appendix Fig. S5. (C) Membrane potential of proband and control fibroblasts as measured by TMRE fluorescence with and without FCCP treatment. Mean and SEM of five biological replicates are shown. Significance was calculated from an ordinary One-way ANOVA analysis. (D) Total cellular ATP content taken from lysed proband and control fibroblasts using a luciferase reporter. Mean and SEM are of five biological replicates are shown. Significance was calculated using an unpaired t test. ns not significant, *P < 0.05, **P < 0.01, ***P < 0.001. Source data are available online for this figure.
Figure EV1
Figure EV1. 3D molecular modeling of dominant variants in ATP5F1A and ATP5F1B.
(A) Side and (B) top-down views of the cryo-structure of α- and β-subunits of ATP synthase. (C) A zoomed in view of the β:α:β subunits. The ATP5F1A variants (L109S, R182Q, P331L and S346F) from this study are shown in cyan, the previously published ATP5F1A variant (R207H) and ATP5F1B variants (T334P, L335P, V482A) are shown in yellow and magenta, respectively. Alignment, visualization, and mutagenesis were performed by using PyMOL (version 2.5.5) using previously described structural models comprising the 10-subunit human ATP synthase (PDB: 8H9S) (Lai et al, 2023).
Figure EV2
Figure EV2. Proteomics analysis of mitochondrial proteins.
(A) Volcano plot of mitochondrial proteins annotated from MitoCarta3.0 of Proband 2 (p.R182Q) lymphoblastoid cell lines (LCLs) compared to controls (N = 4) showing reduced abundance of subunits of Complex V. Vertical lines represent ± 2-fold-change equivalent and horizontal lines represent significance P value = 0.05 equivalent from a two-sample t test. Red = Complex V subunits. (B) Blue native PAGE and immunoblotting (IB) of LCLs from Proband 2 and two unrelated controls against ATP5F1A and SDHA antibodies showing reduced abundance of complex V in Proband 2. CBB: Coomassie Brilliant Blue. (C) Topographical heatmap of the log2 fold-change abundances onto the cryo-EM structure of the dimer complex V structure for probands 1, 2, 4 and 6 as well as disease controls with known biallelic pathogenic variants in ATP5F1D and ATP5PO relative to controls. The topographical heatmaps are coloured using the fold-changes from the t-test results obtained in (A). Source data are available online for this figure.

Update of

References

    1. Abrahams JP, Leslie AG, Lutter R, Walker JE (1994) Structure at 2.8 A resolution of F1-ATPase from bovine heart mitochondria. Nature 370:621–628 - PubMed
    1. Anders KR, Botstein D (2001) Dominant-lethal alpha-tubulin mutants defective in microtubule depolymerization in yeast. Mol Biol Cell 12:3973–3986 - PMC - PubMed
    1. Anderson NS, Haynes CM (2020) Folding the mitochondrial UPR into the integrated stress response. Trends Cell Biol 30:428–439 - PMC - PubMed
    1. Bejsovec A, Anderson P (1988) Myosin heavy-chain mutations that disrupt Caenorhabditis elegans thick filament assembly. Genes Dev 2:1307–1317 - PubMed
    1. Berman HM, Westbrook J, Feng Z, Gilliland G, Bhat TN, Weissig H, Shindyalov IN, Bourne PE (2000) The Protein Data Bank. Nucleic Acids Res 28:235–242 - PMC - PubMed

Substances