

Differential gene expression and immune profiling in Parkinson's disease: unveiling potential candidate biomarkers
- PMID: 40859216
- PMCID: PMC12382031
- DOI: 10.1186/s12883-025-04388-x
Differential gene expression and immune profiling in Parkinson's disease: unveiling potential candidate biomarkers
Abstract
Background: Parkinson's disease (PD) represents a common neurodegenerative disorder characterized by a multifaceted interaction with immune infiltration. Despite a well-defined clinical diagnosis, the misdiagnosis rate of PD remains around 20%. The aim of this study is to discover new diagnostic biomarkers for PD and investigate their pathogenesis to improve early intervention and effective management of patients with PD.
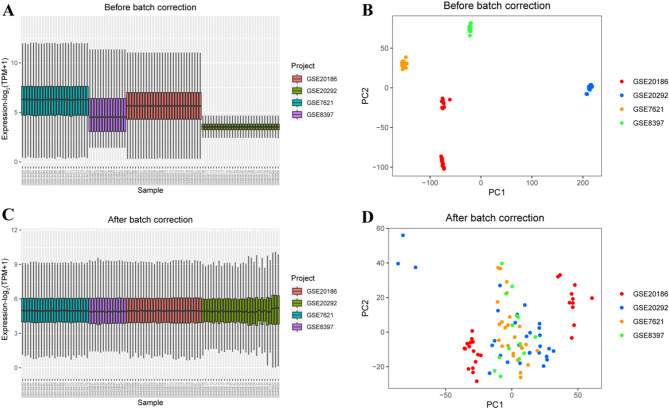
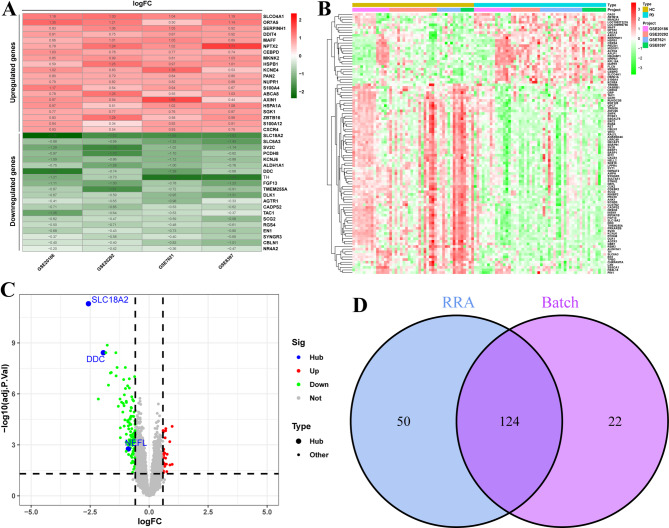
Methods: Five PD-related GEO datasets were used: four for training (GSE7621, GSE8397, GSE20186, and GSE20292) and one for validation (GSE26927). Gene expression analysis included batch correction and "RobustRankAggreg" (RRA) methods. Differentially expressed genes (DEGs) were linked to functions via Gene Ontology (GO) and Kyoto Encyclopedia of Genes and Genomes (KEGG). Hub genes were identified using CytoHubba in Cytoscape and validated with ROC analysis. Real-time quantitative polymerase chain reaction (RT-qPCR) confirmed hub gene expression in PD patients' substantia nigra. CIBERSORT, along with the Wilcoxon test and Least Absolute Shrinkage and Selection Operator (LASSO) regression, analyzed differences in immune cell abundance between PD patients and healthy controls (HC). Spearman's rank correlation in R explored the link between biomarkers and immune cells.
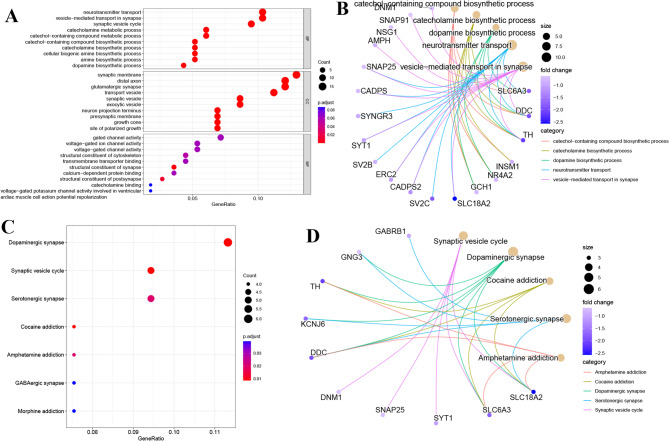
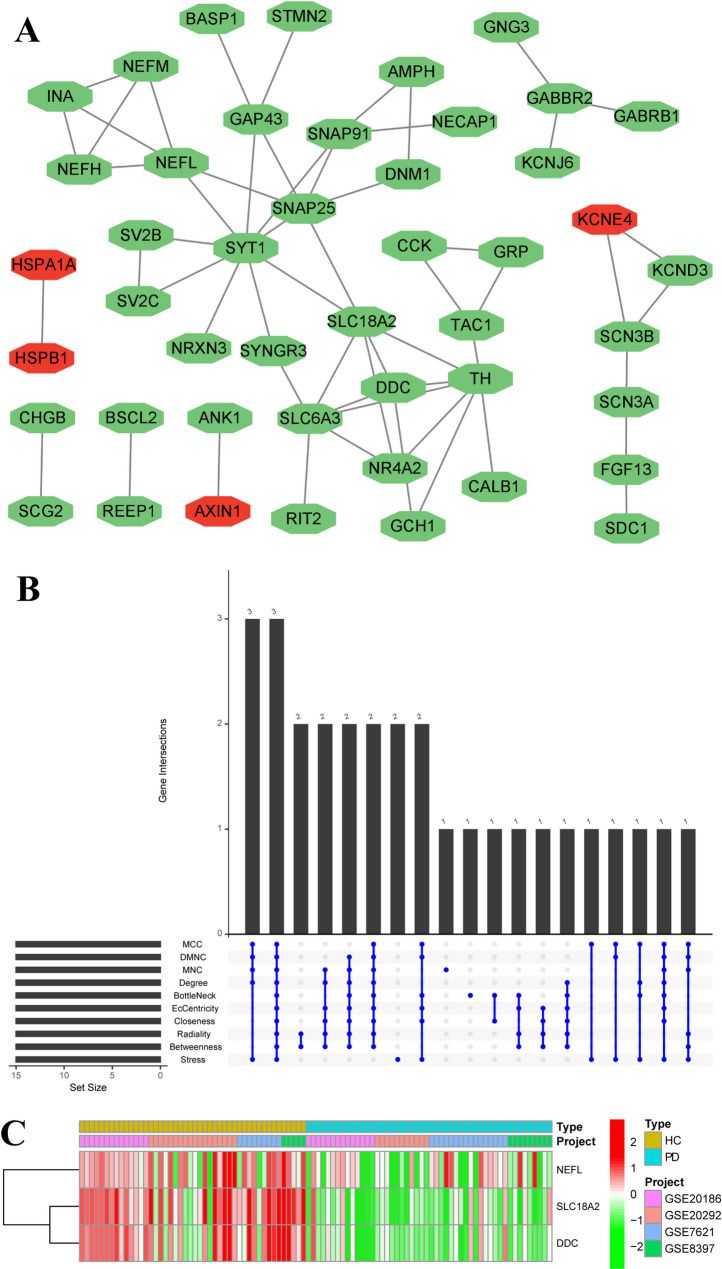
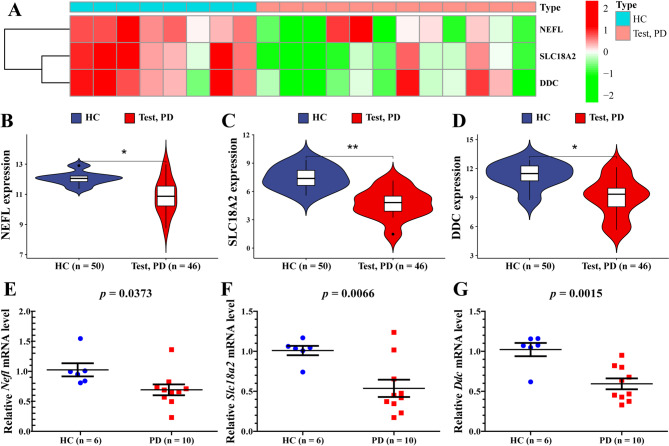
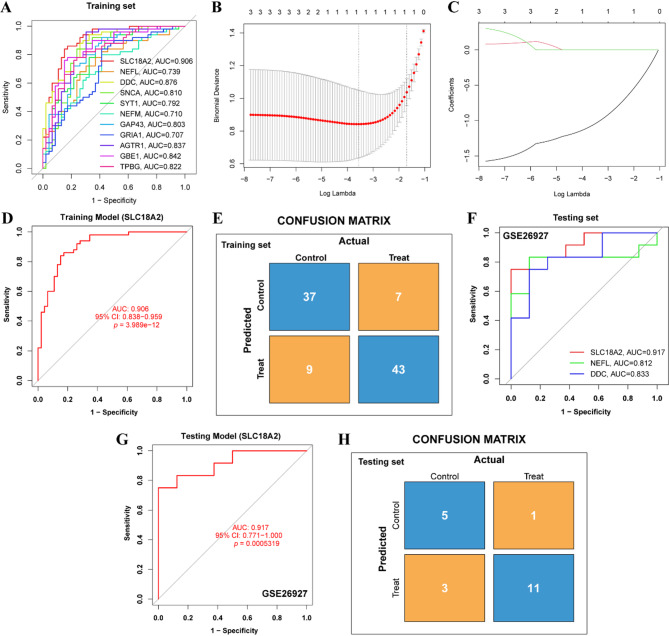
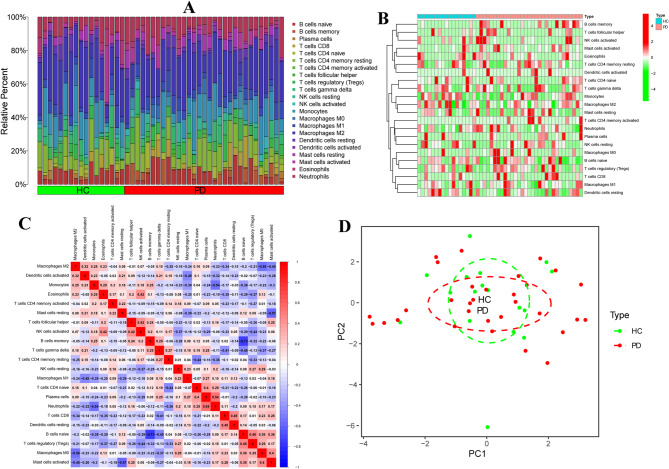
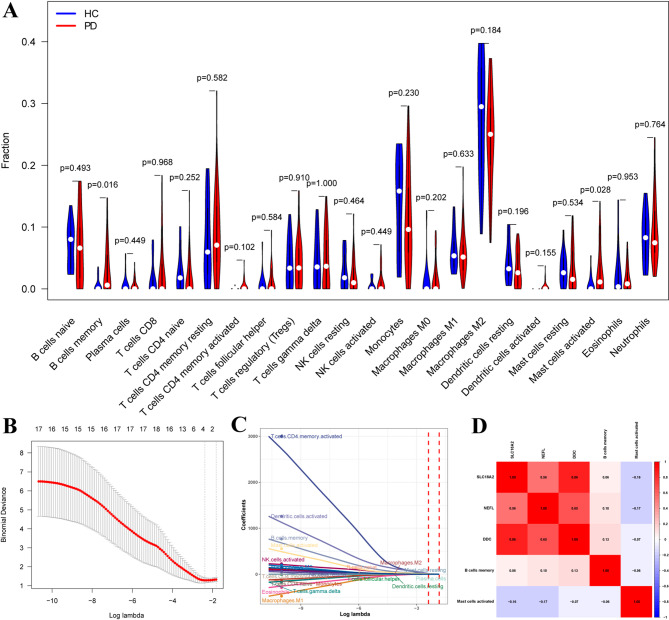
Results: The intersection of two methods identified 124 DEGs in PD. GO analysis revealed enrichment in neurotransmitter transport, while KEGG analysis identified involvement in the dopaminergic synapse pathway. Three hub genes (DDC, NEFL, and SLC18A2) were identified using the "UpSet" R package, and their expression was significantly lower in PD patients than in the HC group (all p < 0.05), as confirmed by RT-qPCR. LASSO regression and ROC analysis demonstrated that SLC18A2 could diagnose PD with high specificity and sensitivity in both training (0.85 and 0.84) and validation sets (1.00 and 0.75). CIBERSORT analysis showed increased memory B cells, activated mast cells, NK cells, and CD8+ T cells in PD, with notable differences in the abundance of memory B cells and activated mast cells between PD and HC.
Conclusion: The study identifies SLC18A2 as a potential candidate biomarker for PD and emphasizes the involvement of memory B cells and activated mast cells in the onset and progression of the disease.
Keywords: Bioinformatics; Diagnostic biomarkers; Memory B cells; Parkinson's disease; SLC18A2.
© 2025. The Author(s).
Conflict of interest statement
Declarations. Ethics approval and consent to participate: The studies involving human participants received approval from the Board of Directors and the Ethics Committee of Lishui City People’s Hospital (approval number LCPH20240047) and were carried out in compliance with the 1975 Declaration of Helsinki. Informed written consent was obtained from all participants involved in the study. Consent for publication: Not applicable. Competing interests: The authors declare no competing interests.
Figures
Similar articles
-
Identification of SNCA and DRD2 as key genes linking parkinson's disease and circadian rhythm through bioinformatics analysis.Sci Rep. 2025 Aug 26;15(1):31355. doi: 10.1038/s41598-025-16854-0. Sci Rep. 2025. PMID: 40859027 Free PMC article.
-
Machine learning and bioinformatics analysis to identify and validate diagnostic model associated with immune infiltration in rheumatoid arthritis.Clin Rheumatol. 2025 Jul;44(7):2683-2694. doi: 10.1007/s10067-025-07514-9. Epub 2025 Jun 11. Clin Rheumatol. 2025. PMID: 40500570
-
The mitochondrial hub gene UCHL1 May serve as a potential biomarker for diagnosing diabetic cardiomyopathy: a comprehensive integration of biological pathways.BMC Med Genomics. 2025 Aug 11;18(1):129. doi: 10.1186/s12920-025-02199-0. BMC Med Genomics. 2025. PMID: 40790764 Free PMC article.
-
Dopaminergic responsiveness and dopaminergic challenge tests of Parkinson's disease: a systematic review and meta-analysis.J Neurol. 2025 Feb 1;272(2):176. doi: 10.1007/s00415-025-12894-8. J Neurol. 2025. PMID: 39891751
-
Link between Parkinson's disease and melanoma: insights into the influence of the PARK gene family.Front Oncol. 2025 Aug 11;15:1506744. doi: 10.3389/fonc.2025.1506744. eCollection 2025. Front Oncol. 2025. PMID: 40860809 Free PMC article. Review.
References
MeSH terms
Substances
Grants and funding
LinkOut - more resources
Full Text Sources
Medical
Research Materials
